What Does It Mean to Visualize a Database?
To visualize database content means turning raw data into simple visuals like charts, tables, or diagrams. Instead of reading rows and columns, you see patterns, trends, and relationships at a glance.
This is where database diagramming becomes useful. It helps map how data connects, making it easier to understand even for non-technical users.
For example, a table of customer orders can quickly become a chart showing top products or a diagram showing how customers relate to orders.
## **Why Visualization Matters**Raw data can be hard to read. Visualization makes it easier.
Here’s why teams rely on it:
- It simplifies complex data
- It helps find errors faster
- It improves decision-making
- It supports better teamwork
According to Tableau’s guide to data visualization, visual data helps people process information much faster than plain text.
How Baserow Helps You Visualize a Database Easily
Modern tools make database visualization simple, even without coding.
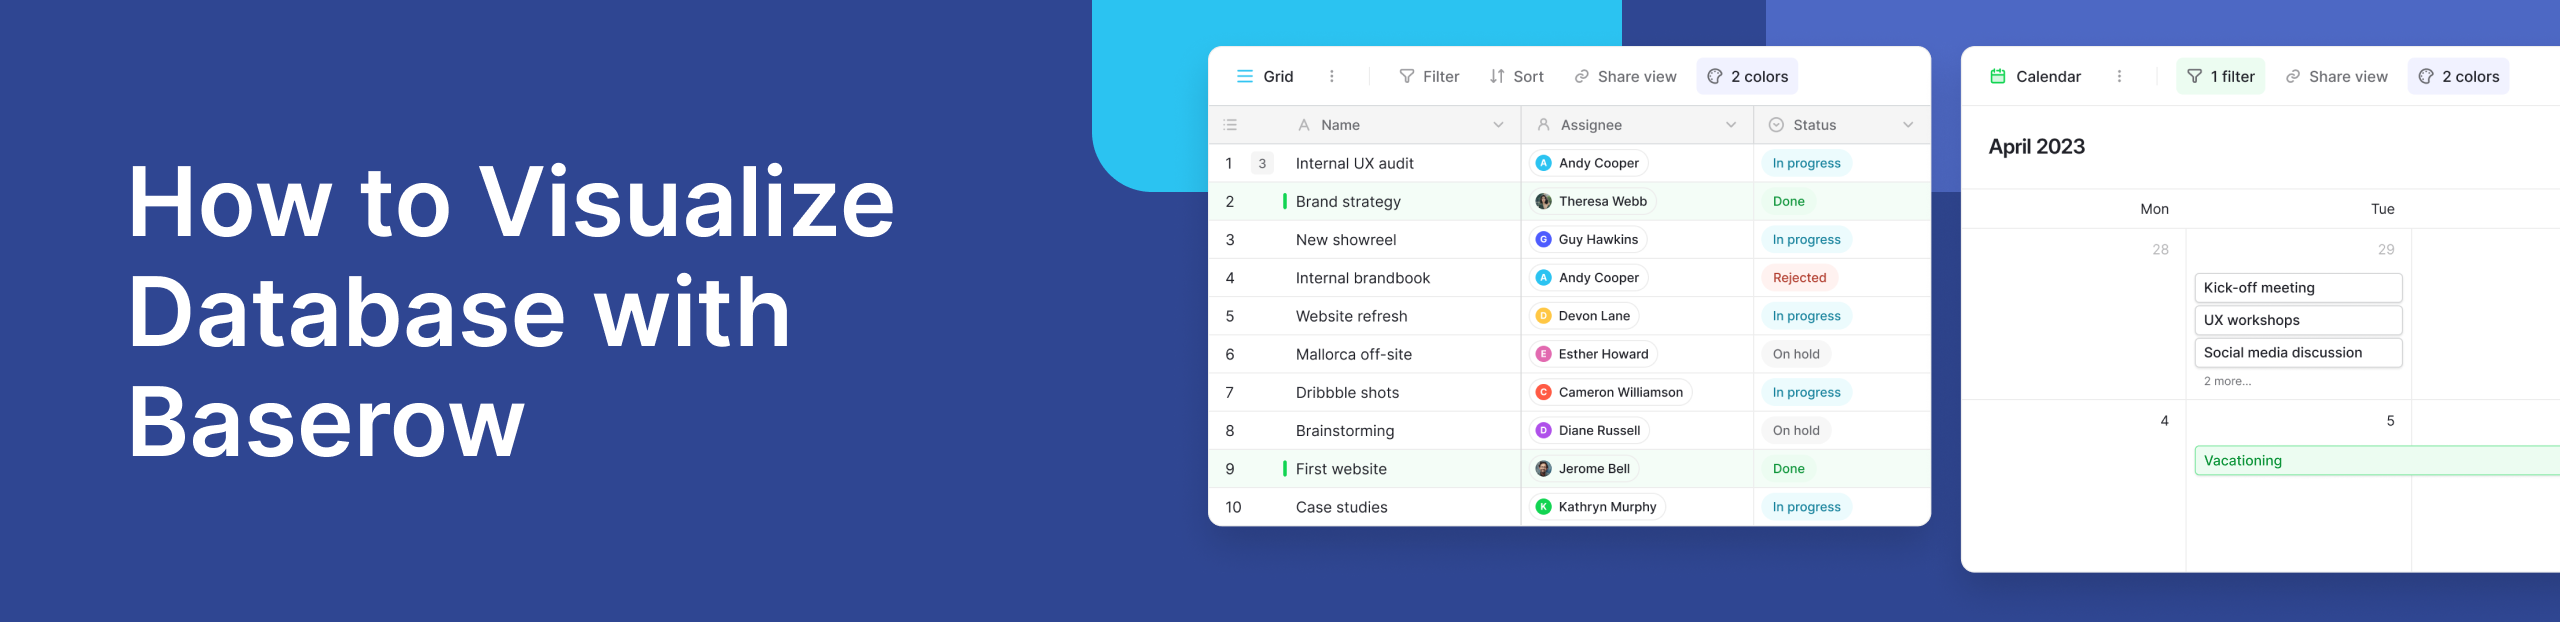
With Baserow, you can turn your database into visual views in minutes. It offers a clean interface where you can switch between grid views, galleries, and more. You can also use Baserow dashboards to build charts and track metrics in real time.
If you want to explore how teams use it, this community discussion shows practical ways users connect their data to visual tools. Baserow also supports automation and integrations, making it easier to keep your visuals updated without manual work.
Common Ways to Visualize a Database
- Entity Relationship Diagrams (ERDs): ERDs show how different parts of a database connect. They are useful for planning and understanding structure.
- Charts and Dashboards: Charts help you track trends. Dashboards combine multiple visuals in one place. For example, teams often use tools like dashboards to monitor performance in real time.
- Graph-Based Views: These show relationships as networks. They are useful for complex systems like social connections or supply chains.
How to Visualize a Database (Step-by-Step)
You can follow a simple process:
- Define your goal: Decide what you want to learn from your data.
- Organize your data: Clean and structure your tables.
- Choose the right tool: Tools like Baserow make this easy without coding.
- Create visuals: Use charts, tables, or diagrams.
- Review and improve: Adjust your visuals to make them clearer.
For deeper strategies, you can explore this data visualization guide for teams.
Use Case: Project Tracking with Visual Databases
Imagine a team managing projects. Instead of looking at raw tables, they use visual dashboards to:
- Track task progress
- Monitor deadlines
- Identify delays
With Baserow, teams can quickly switch from a table view to a visual dashboard. This makes it easier to understand project status without digging through rows of data.
Best Practices for Effective Visualization
Keep these tips in mind:
- Keep visuals simple
- Use clear labels
- Avoid too many charts at once
- Focus on the most important data
A good rule is clarity over complexity. If a chart is hard to understand, simplify it.
Frequently Asked Questions
- How to visualize a database?
To visualize a database, you first need to understand what you want to learn from your data. Start by organizing your tables so the data is clean and structured. Then choose a tool that can turn that data into visuals like charts, dashboards, or diagrams. Tools like Baserow make this easier by letting you switch between views without coding. The key is to focus on visuals that make patterns and trends easy to spot.
- What is the main purpose of ERD?
The main purpose of an Entity Relationship Diagram (ERD) is to show how different pieces of data are connected. It helps you understand the structure of a database before or after it is built. For example, an ERD can show how customers relate to orders or how products connect to categories. This makes it easier to design, manage, and troubleshoot databases, especially when working with large systems or teams.
- What are the 4 types of database?
There are four common types of databases, each designed for different use cases. Relational databases store data in tables with rows and columns, and they are the most widely used. Hierarchical databases organize data in a tree-like structure, where each record has a parent-child relationship.
Network databases are similar but allow more flexible connections between records. Object-oriented databases store data as objects, which is useful when working with applications built using object-oriented programming. Each type helps manage data in a way that fits different needs.
- What is the tool to visualize SQL database?
There are many tools available to visualize SQL databases, depending on your needs. Tools like Baserow provide a no-code way to view and explore data through tables, grids, and dashboards. The best tool depends on your skill level and use case. If you want something simple and fast, no-code tools are often the easiest place to start.
Conclusion
When you visualize database content, you turn complex data into clear insights. This helps teams make faster and better decisions.
Tools like Baserow make this process simple. You don’t need advanced skills to create useful visuals and dashboards. If you want to start building smarter workflows with visual data, you can try it here:


See who's editing in real time, organize data with new Group By views, execute JavaScript, build reusable workflows, import Excel files, and more in Baserow 2.3.

Discover how Airtable and Baserow compare in features, flexibility, speed, and scalability. Compare pricing plans and hidden costs to make an informed decision!

Explore the best open-source software alternatives to proprietary products. Discover OSS tools, licenses, and use cases with our updated directory.