What is Project Analytics?
Project analytics is the process of using data analytics and data analysis to understand how a project is progressing. It helps teams track performance, measure results, and improve decisions at every stage of the project lifecycle.
Every project generates a large amount of project data. This includes timelines, tasks, budgets, and team performance. When this data is analyzed properly, it gives clear insights into what is working and what needs improvement.
Instead of relying on guesswork, teams can use analytics to see how a project performed in real time. This helps them avoid delays, manage risks, and improve future planning.
For example, a team working on multiple campaigns can track deadlines, costs, and outcomes in one place. With the right tools, they can turn raw data into simple dashboards that are easy to understand.
Why Project Analytics Matters for Modern Teams
Modern teams deal with complex projects that involve many moving parts. Without proper tracking, it becomes difficult to manage resources and meet deadlines.
Project analytics helps teams:
- Make data driven decisions instead of assumptions
- Track progress across the entire project lifecycle
- Identify risks before they become major issues
- Improve project success rates over time
It also connects with tools like business intelligence platforms and artificial intelligence systems. These technologies help teams analyze patterns and trends in large datasets.
For example, artificial intelligence can suggest better timelines based on past performance. Similarly, business intelligence tools can provide visual dashboards to simplify reporting.
By using analytics, teams can clearly understand project outcomes and make smarter decisions.
Key Features to Look for in Project Analytics Tools
Choosing the right tool is important. Many tools offer analytics, but not all are easy to use or flexible.
- Real-time dashboards
Dashboards help you see project performance instantly. Instead of waiting for reports, you can track updates as they happen.
- Data visualization and reporting
Charts and graphs make it easier to understand complex data. Good tools simplify data analysis so even non-technical users can use them.
- Predictive analytics capabilities
Predictive analytics helps forecast future results. It uses past data to estimate timelines, risks, and outcomes.
- Integration with project management software
Your analytics tool should work well with your existing project management software. This ensures smooth data flow.
- Automation and machine learning insights
Advanced tools use machine learning to detect patterns and automate tasks. This reduces manual effort and improves accuracy.
Many traditional tools are complex and require technical knowledge. This is where no-code platforms offer a simpler alternative.
Best Project Analytics Tools
1. Baserow
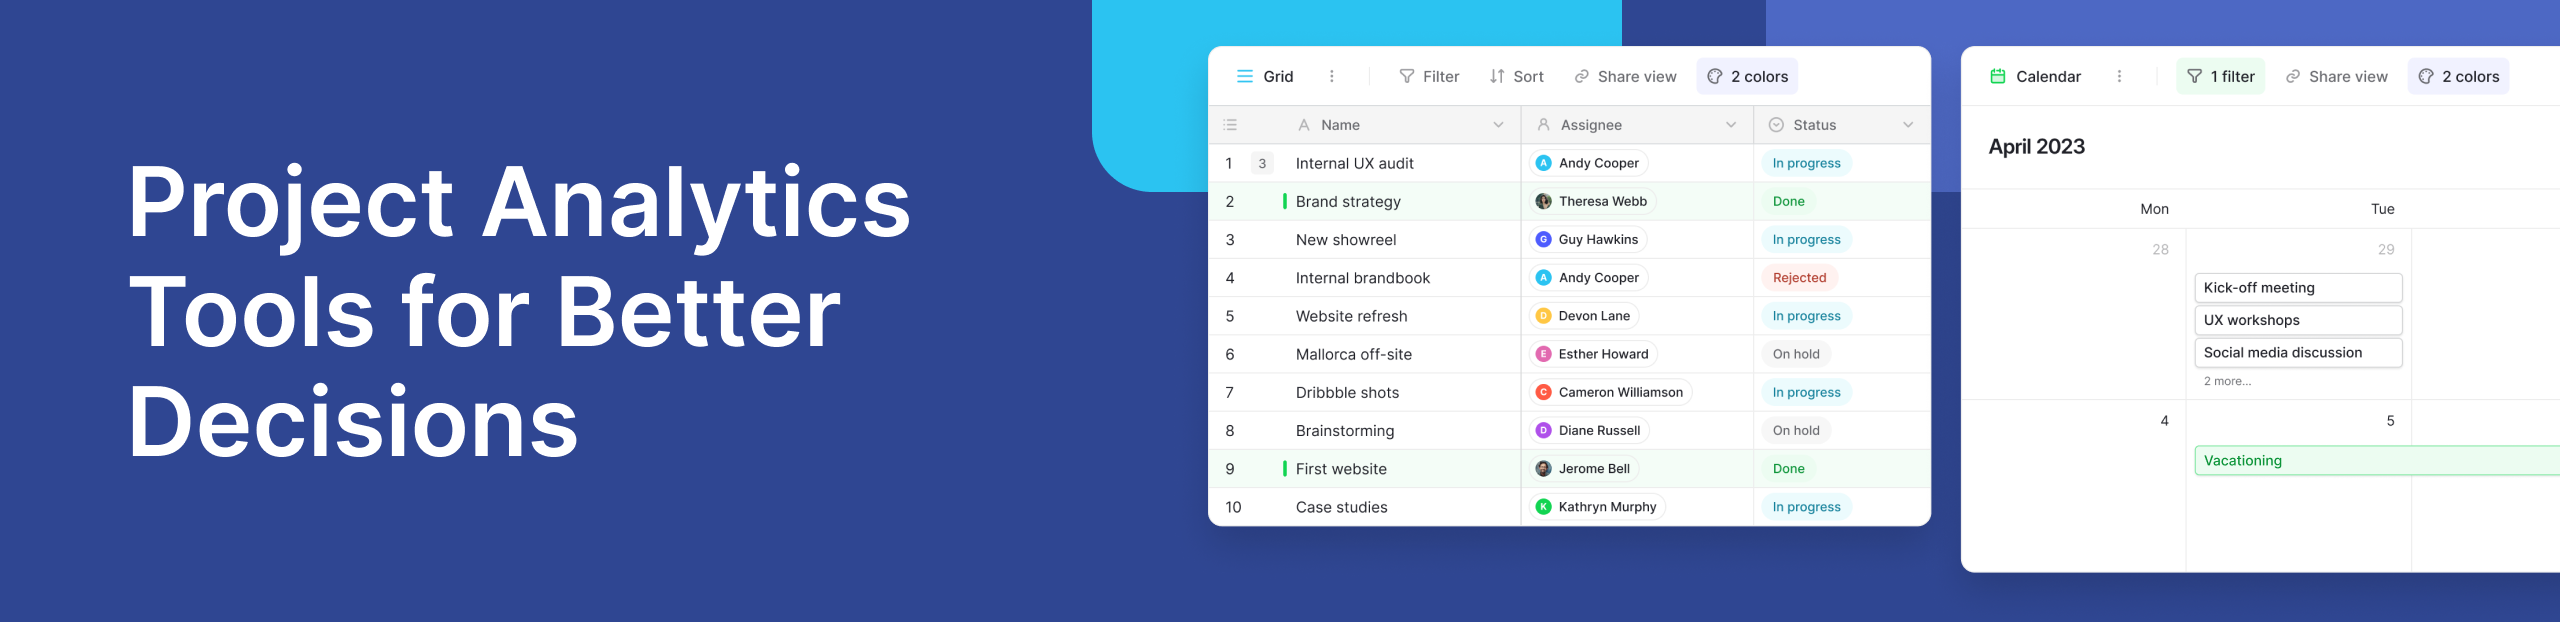
Baserow is a flexible no-code platform that combines database management with analytics. It allows teams to organize project data, build dashboards, and track performance without writing code.
With features like custom dashboards, teams can visualize progress in real time. Its structured approach to data makes it easier to manage tasks, timelines, and resources across the entire project lifecycle. If you are new to working with structured data, this introductory guide explains how to get started in a simple way.
To better understand how Baserow helps teams manage and analyze projects, watch this quick overview:
A common use case shared in the Baserow community involves teams managing multiple projects in one workspace. They track tasks, assign responsibilities, and monitor project outcomes using simple dashboards. This gives them a clear view of how each project performed and helps them make faster decisions.
Baserow also supports automation and workflow triggers, which reduce manual work and improve consistency. As projects grow in complexity, having a tool that combines data structure with analytics becomes important. This is where Baserow fits naturally, helping teams move from scattered data to clear, actionable insights without adding technical overhead.
2. Plausible Analytics
Plausible Analytics is a privacy-focused tool. It is lightweight and easy to use, making it suitable for teams that want simple analytics without tracking users.
3. Umami
Umami is an open-source analytics platform. It is fast, simple, and provides clear insights without unnecessary complexity.
4. Ackee
Ackee is a self-hosted analytics solution. It focuses on privacy and gives teams full control over their data.
5. Tableau
Tableau is a powerful business intelligence tool. It offers advanced data visualization and is widely used by large organizations.
6. Microsoft Power BI
Power BI is another popular business intelligence platform. It integrates well with Microsoft tools and supports detailed reporting.
7. ClickUp
ClickUp combines project management software with analytics features. Teams can track tasks and view performance through built-in dashboards.
8. Monday.com
Monday.com offers visual project tracking with simple analytics tools. It is useful for teams that want an easy-to-use interface.
9. Google Analytics
Google Analytics is mainly used for website tracking. However, it can also support projects that involve digital campaigns.
How to Use Project Analytics to Improve Results
To get the most value, teams should focus on how they use analytics, not just the tools.
Start by tracking how each project performed. Compare planned timelines with actual results. This helps identify delays and inefficiencies.
Next, use predictive analytics to forecast future performance. For example, if similar projects faced delays, you can plan better timelines. Teams should also monitor key metrics regularly. This includes costs, deadlines, and resource usage.
Most importantly, use insights to improve project outcomes. Analytics should guide decisions, not just report data.
Real Use Case: Managing Complex Projects with Baserow
Imagine a team handling multiple client projects. Each project has different timelines, tasks, and team members. Using Baserow, they create a central database to store all project data. They then build dashboards to track progress in real time.
When a delay occurs, the team can quickly identify the issue and take action. Over time, they use past data to improve planning and avoid repeated mistakes. This approach works well for complex projects where visibility and control are important.
Common Challenges in Project Analytics
Many teams face challenges when using analytics tools.
- Data is stored in different systems, making it hard to manage
- Poor data quality leads to inaccurate insights
- Some tools are too complex for everyday use
- Lack of real-time updates slows decision-making
A simple and flexible tool can solve these issues by bringing everything into one place.
Conclusion
Project analytics helps teams understand performance, improve planning, and achieve better results. By using the right tools, teams can turn data into clear insights and make smarter decisions.
If you are looking for a simple way to manage and analyze your projects, you can explore Baserow. Its flexible approach makes it easy to organize data and build dashboards without complexity.

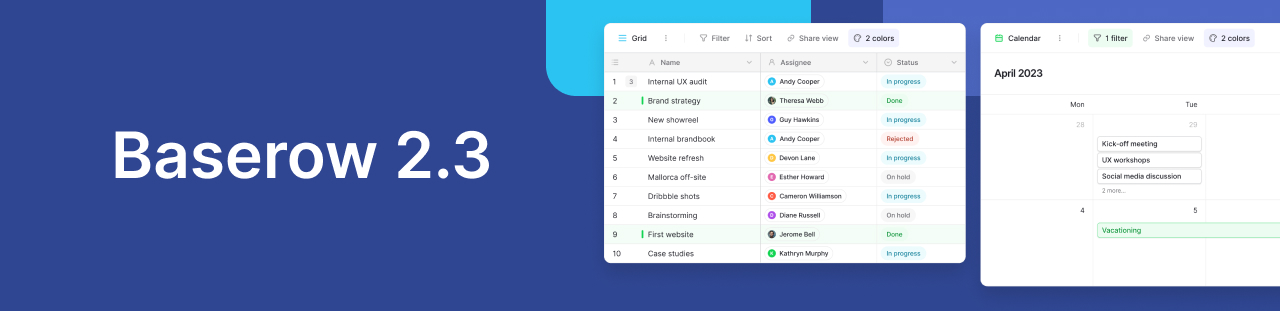
See who's editing in real time, organize data with new Group By views, execute JavaScript, build reusable workflows, import Excel files, and more in Baserow 2.3.

Discover how Airtable and Baserow compare in features, flexibility, speed, and scalability. Compare pricing plans and hidden costs to make an informed decision!

Explore the best open-source software alternatives to proprietary products. Discover OSS tools, licenses, and use cases with our updated directory.