
Creating a spreadsheet in Excel is one of the easiest ways to organize information, track data, and manage projects. Whether you’re building a budget, tracking inventory, managing contacts, or organizing tasks, Excel provides a flexible spreadsheet interface that works for almost any use case.
In this guide, you’ll learn how to create a spreadsheet in Excel from scratch, format it properly, organize your data, and turn it into a functional table that is easy to manage.
What Is an Excel Spreadsheet?
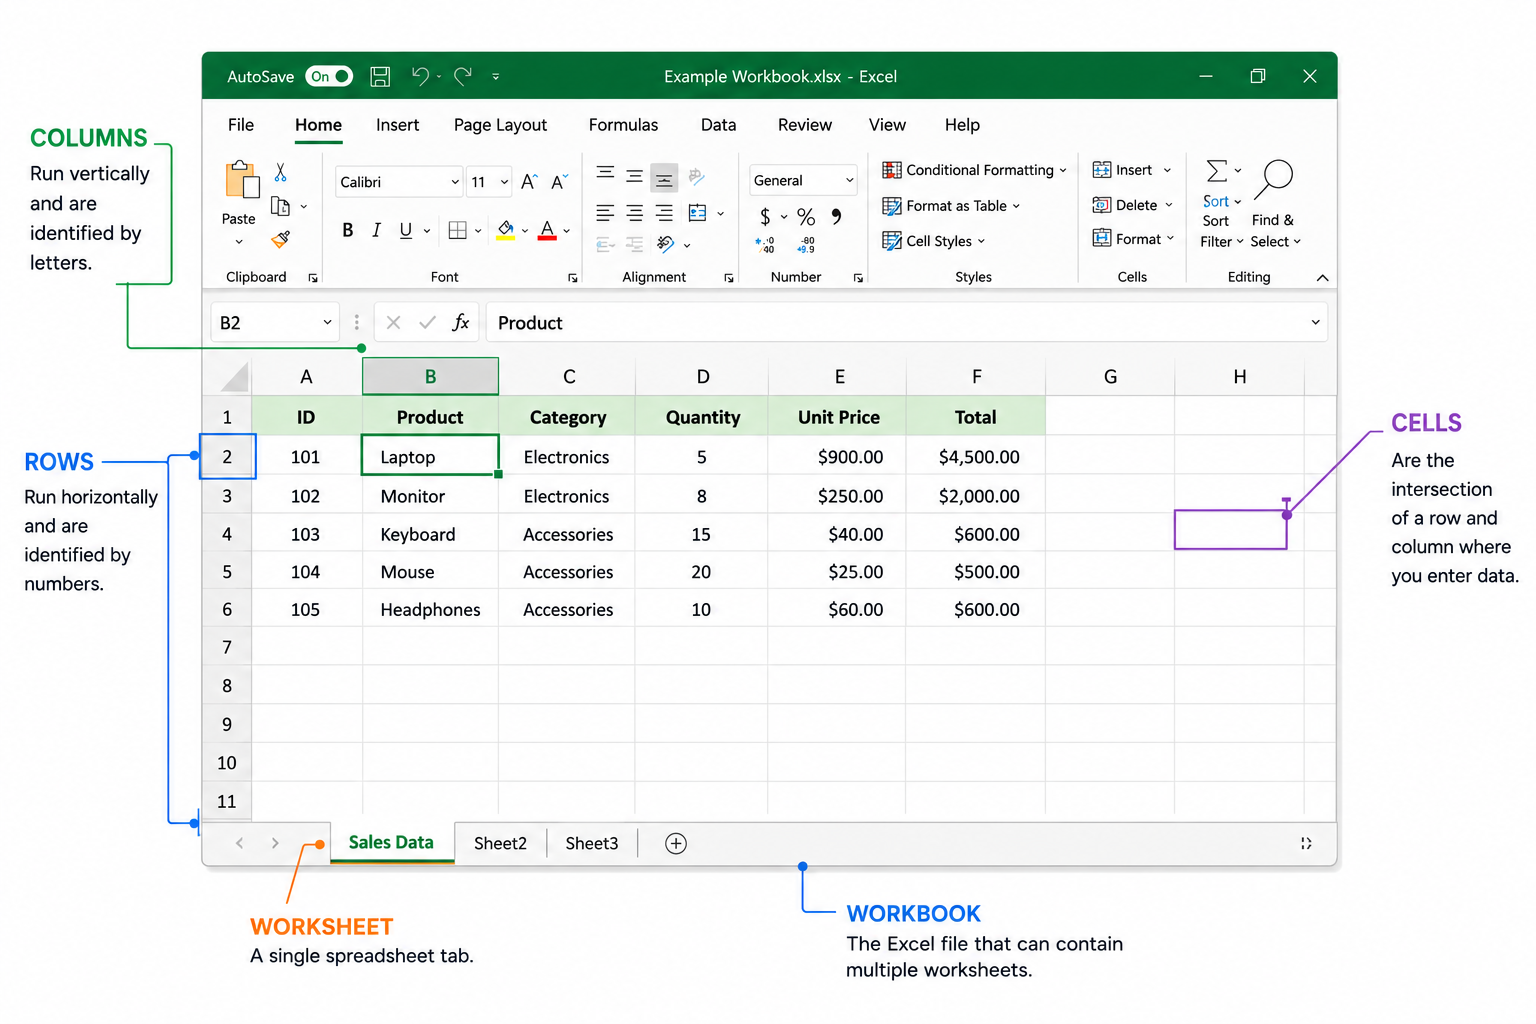
An Excel spreadsheet is a digital worksheet made up of rows, columns, and cells.
- Rows run horizontally and are identified by numbers.
- Columns run vertically and are identified by letters.
- Cells are where you enter data.
- A worksheet is a single spreadsheet tab.
- A workbook is the Excel file that can contain multiple worksheets.
Spreadsheets are commonly used for budgeting, project management, reporting, inventory tracking, customer management, and data analysis.
Step 1: Open Excel and Create a New Workbook
To create a spreadsheet in Excel:
- Open Microsoft Excel.
- Select Blank Workbook.
- A new spreadsheet will open automatically.
- Save the workbook with a descriptive name.
You can also start with one of Excel’s built-in templates if you’re creating a budget, schedule, invoice, or project tracker.
Step 2: Add Column Headers
Before entering data, create headers for each column.
For example, if you’re creating a project tracker, your spreadsheet might look like this:
Headers help keep your spreadsheet organized and make it easier to sort and filter information later.
Use clear and descriptive names for each column so anyone viewing the spreadsheet understands the data immediately.
Step 3: Enter Your Data
After creating headers, begin adding data below each column.
Excel supports many types of data, including:
- Text
- Numbers
- Dates
- Currency values
- Percentages
For example:
Try to keep information consistent throughout the spreadsheet. For example, use the same date format and naming conventions across all rows.
Step 4: Format Your Spreadsheet
Formatting improves readability and helps important information stand out.
Useful formatting options include:
Bold Your Headers
Select the header row and click Bold to make column names easier to identify.
Adjust Column Widths
Double-click the edge of a column header to automatically fit the contents.
Apply Number Formats
Excel allows you to format values as:
- Currency
- Percentage
- Date
- Time
- Number
This makes data easier to understand and reduces errors.
Add Colors and Borders
Use subtle colors and borders to separate sections and improve visual organization.
Avoid excessive formatting, as overly colorful spreadsheets can become difficult to read.
Step 5: Convert Your Data Into a Table
One of the most useful Excel features is the ability to turn data into a table.
To create a table:
- Select your data range.
- Click Insert.
- Select Table.
- Confirm the correct range.
- Click OK.
Using an Excel table provides several benefits:
- Automatic filtering
- Easier sorting
- Consistent formatting
- Better organization
- Structured references
Tables are especially useful when your spreadsheet grows over time.
Step 6: Save Your Spreadsheet
To save your work:
- Click File → Save As.
- Choose a location.
- Enter a file name.
- Click Save.
You can also save your spreadsheet to OneDrive to access it from multiple devices and collaborate with others.
Saving regularly helps prevent data loss and ensures you always have the latest version of your workbook.
💡 What’s next?
Once you’ve created your spreadsheet, you can start performing calculations and analyzing data using formulas. Learn the most common functions, formulas, and real-world examples in our guide to Spreadsheet Formulas: Examples and How to Use Them.
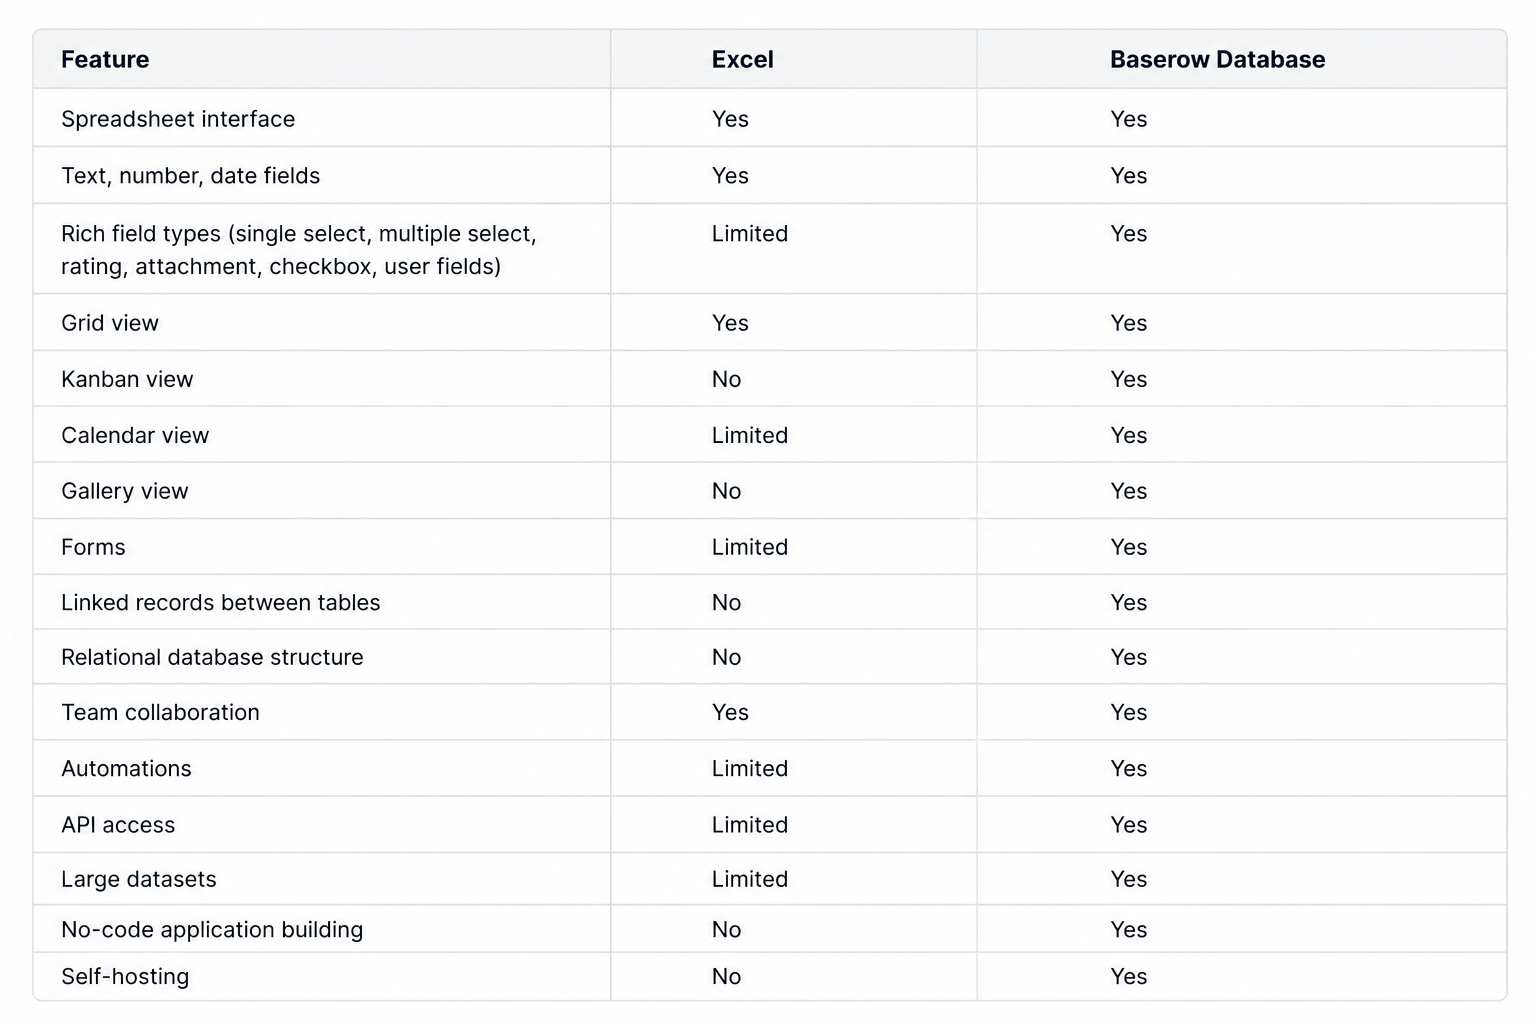
Excel vs Modern Spreadsheet Databases
While Excel remains one of the most popular spreadsheet tools, many teams now need features that go beyond traditional spreadsheets.
For simple spreadsheets, Excel works well. For managing large datasets, workflows, and collaborative projects, a spreadsheet-database platform may provide additional flexibility.
Create Spreadsheets Faster With Baserow
If you enjoy the simplicity of spreadsheets but need more powerful data management capabilities, Baserow combines a familiar spreadsheet interface with the flexibility of a database.
You can:
- Create spreadsheets without coding
- Organize structured data
- Collaborate with your team
- Build workflows and automations
- Connect data through APIs
- Start from ready-made templates
This makes it easier to move beyond basic spreadsheets as your projects grow.
Final Thoughts
Learning how to create a spreadsheet in Excel is a foundational skill for organizing information and managing data. By creating clear headers, entering structured information, formatting your spreadsheet properly, and using tables, you can build spreadsheets that are easy to maintain and scale.
And if you eventually outgrow traditional spreadsheets, spreadsheet like database tools like Baserow can help you manage more complex workflows while keeping the familiar spreadsheet experience.


See who's editing in real time, organize data with new Group By views, execute JavaScript, build reusable workflows, import Excel files, and more in Baserow 2.3.

Discover how Airtable and Baserow compare in features, flexibility, speed, and scalability. Compare pricing plans and hidden costs to make an informed decision!

Explore the best open-source software alternatives to proprietary products. Discover OSS tools, licenses, and use cases with our updated directory.