
Every campaign produces numbers, from website visits to sales enquiries. The challenge is knowing which numbers explain progress and which ones simply make a report look busy.
Measuring campaign performance means collecting, comparing, and interpreting data to understand how promotional activity supports business goals. It helps teams identify useful channels, improve messages, and decide where to spend their next budget.
A clear marketing strategy starts with questions that data can answer. Which campaign attracts suitable leads? Where do people leave the signup process? Does additional spending produce enough value? Answering these questions makes reporting part of daily decisions rather than a monthly administrative task.
What should a team measure?
The right measures depend on your goal. A brand awareness campaign needs different evidence from a campaign designed to generate sales enquiries. Choose a few useful measures before launching, then apply the same definitions throughout your review.
- Reach and engagement
Reach shows how many people may have seen your content. Engagement covers actions such as clicks, replies, and video views. Together, these measures help compare marketing channels and identify where your message attracts attention.
Look for customers engaging in ways that support your goal. A thoughtful reply from a potential buyer may matter more than hundreds of passive reactions. Check what people do after clicking, and whether they reach a useful page or leave immediately.
- Conversions and value
A conversion is a chosen action, such as completing a form or making a purchase. Calculate conversion rate by dividing completed actions by the relevant audience count, then multiplying by 100. State whether that audience means visitors, sessions, or leads so comparisons remain fair.
For example, 40 registrations from 1,000 landing page visits represent a 4% signup rate. In Google Analytics, important actions can be marked as key events, allowing teams to review their frequency across reports.
Return on investment (ROI) compares the financial gain from a campaign with its cost. One approach subtracts campaign cost from the attributable gross profit, divides the result by campaign cost, then multiplies by 100. Using revenue alone can overstate the return because it ignores delivery costs.
- Customer outcomes
Campaign results also reveal customer preferences. Compare which topics generate useful enquiries, which offers attract repeat purchases, and which pages help people complete a task.
Combine those patterns with feedback about the customer experience. If visitors click an advert but struggle with the form, the problem may be the signup process. Fixing that issue could improve results without increasing the advertising budget.
How to turn campaign data into decisions
Data analytics covers the wider practice of gathering, organizing, and interpreting information. Data analysis is the focused work of examining a dataset to answer a particular question. Both become useful when analytical processes follow clear goals and consistent definitions.
- Start with a question and a shared structure
Choose a question such as, “Which webinar promotion brings the most qualified enquiries?” Record the campaign name, audience, dates, budget, and expected outcome before collecting results.
Marketing teams should also agree on what counts as a qualified enquiry. Without that agreement, two departments may report different results from the same activity. When analyzing data, compare matching periods and allow enough time for leads to progress.
- Use consistent campaign tags
UTM parameters are labels added to links to identify the source, medium, and campaign. A shared naming convention prevents the same channel from appearing under several names in your reports.
Google’s campaign URL guidance explains how these labels appear in acquisition reporting. Baserow’s UTM builder walkthrough shows how a team can organize campaign values and generate tagged links with formula fields. Keeping those records together makes comparisons easier when reviewing several marketing campaigns.
- Review the journey before assigning credit
People often encounter several messages before taking action. Someone might discover a webinar through a social post, return through an email, and register after a search. Giving the final click all the credit can hide earlier contributions.
Google’s attribution guidance explains how credit is assigned across these interactions. Use one model consistently, record its assumptions, and remember that attribution describes observed journeys. It does not prove how many sales would disappear if you stopped a channel.
A practical campaign reporting example
Imagine a software company promoting a webinar through email, paid search, and social posts. Its goal is to generate suitable sales conversations. The team needs to connect registrations with attendance, enquiries, and eventual commercial outcomes.
- Bring campaign records together
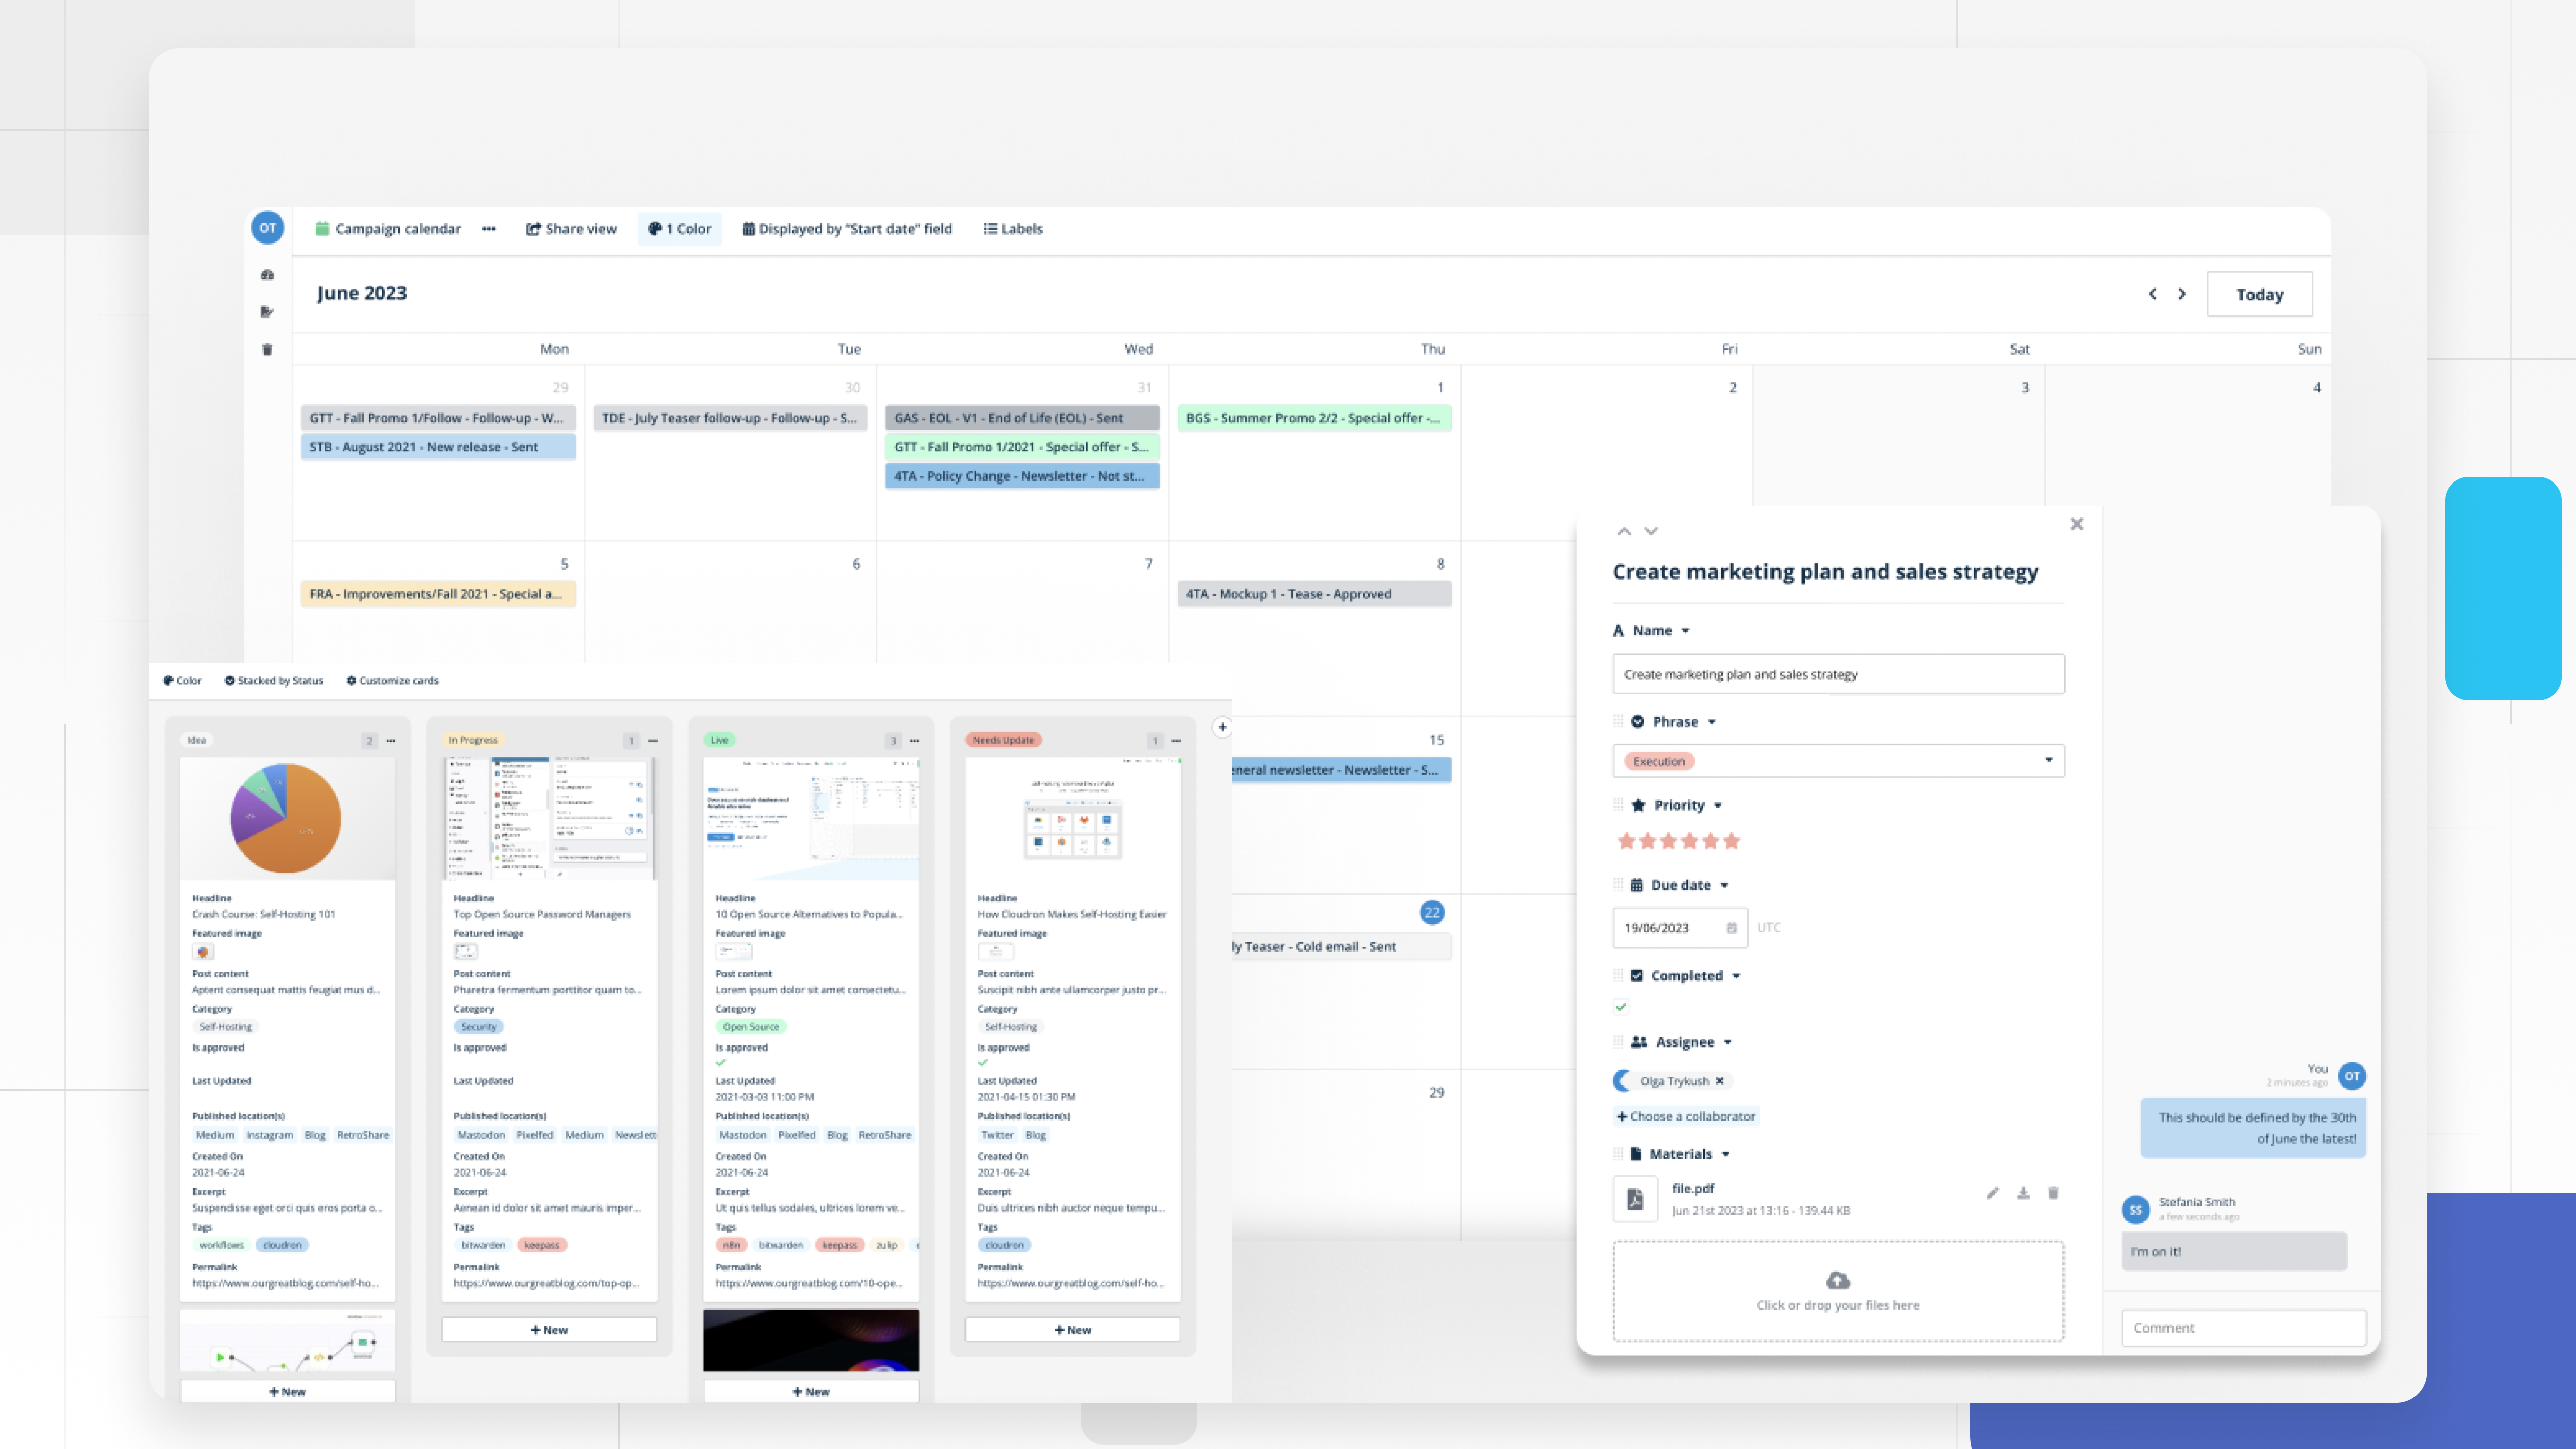
A shared database could contain three linked tables: campaigns, channel results, and leads. Each campaign has an owner, budget, date, and goal. Channel records contain tagged links, spend, visits, and registrations. Lead records capture relevant follow-up stages and link back to the campaign.
Baserow provides a flexible way to organize these relationships. Its Campaign Management template offers a starting point for coordinating activity and tracking performance. The team can adapt its structure to the measures it actually needs.
Website activity comes from the tracking tool. Campaign costs and sales outcomes come from their respective sources, through imports or configured integrations. Record when each source was refreshed so readers understand how current the report is.
- Compare results against the goal
Suppose paid search costs €600 and produces 60 registrations, while email costs €200 and produces 40. Their costs per registration are €10 and €5. Those figures suggest email is cheaper at this stage.
Now suppose search generates 12 qualified enquiries and email generates four. Both cost €50 per qualified enquiry. The comparison changes because the team has followed the journey further. These illustrative figures show why a cheap signup does not always mean a better campaign.
Baserow’s dashboard widgets can display connected table data and update as records change. The team could monitor registrations and qualified enquiries beside campaign budgets. For layout guidance, its business dashboard guide explains how to choose useful measures and present them clearly.
- Learn from a documented community example
In the Baserow community, Olga shared the team’s formula-based UTM generator. The post describes separate tables for campaign names, sources, and mediums, alongside a URL generator. It demonstrates a practical way to standardize link creation before reporting begins.
For teams coordinating campaign plans and customer data, this adaptable structure helps connect information that would otherwise sit in separate spreadsheets. Its value depends on clear ownership and reliable updates.
.png)
What can the numbers miss?
Tracking gaps, duplicate records, and delayed purchases can distort campaign comparisons. Keep marketing efforts connected to business outcomes, but check the evidence before changing budgets. Compare similar audiences and periods, and include feedback from sales conversations.
Predictive analytics uses historical patterns to estimate future outcomes, such as likely demand or lead conversion. Forecasts need sufficient, consistent data and should include uncertainty. A sudden change in pricing or audience behavior can weaken predictions.
Use findings to optimize marketing through small, measurable tests. Change one important variable, define success in advance, and review the result before expanding the approach. Documenting decisions helps the next campaign benefit from what the team has learned.
Frequently asked questions
- Which metrics should a small team track first?
Start with measures tied to your main goal: suitable enquiries, cost per enquiry, and the share that becomes paying customers. Add traffic or engagement measures when they help explain those outcomes. A small set of clearly defined numbers is easier to maintain and interpret. Agree on definitions with sales colleagues so both teams understand what each result represents before comparing campaigns.
- How often should campaign results be reviewed?
Check active campaigns regularly for broken links, unusual spending, or missing data. Review broader performance weekly or monthly, depending on how quickly results develop. For a business with a long sales cycle, evaluate revenue over a longer period. Daily changes may reflect normal variation, so avoid making major budget decisions from a brief spike or decline without investigating its cause.
- How do you calculate a campaign’s return?
First define the costs and financial value included in the calculation. Subtract campaign costs from attributable gross profit, divide by campaign costs, and multiply by 100. Include relevant production and distribution expenses consistently. If sales have not closed, report lead costs separately and label estimated returns clearly. This prevents a forecast from being mistaken for money the business has already earned.
- Can you compare paid and organic channels fairly?
Yes, if you compare the same outcomes, audience definitions, and reporting periods. Include the cost of creating and maintaining organic content rather than treating it as free. Allow for differences in how quickly channels produce results. Attribution rules also affect the comparison, so use consistent settings and review whether several channels helped influence the same customer before they made a purchase.
- What data do you need before making a forecast?
You need reliable historical records that represent the outcome you want to estimate. Useful fields may include spend, lead stages, sales dates, and seasonal changes. There is no universal minimum dataset for every forecast. Check missing values, unusual events, and changes in your business model. Test predictions against later results and revise your approach when actual outcomes differ from the estimates.
- How can a team share results in real time?
Use a shared dashboard connected to maintained source records. Agree on who updates each source and how often updates occur. A dashboard can refresh when its underlying records change, while imported figures may remain older. Display refresh dates and give colleagues appropriate access. Shared visibility helps people identify issues quickly, provided they understand the freshness and limits of the information shown.
Build a clearer reporting routine
To measure the impact of marketing, connect each campaign to a clear goal, consistent records, and outcomes that matter to the business. Review the customer journey, check data quality, and use findings to plan your next test. A dependable reporting routine helps teams explain their choices and learn from each campaign over time.
If you need a flexible place to organize campaign plans and results, try Baserow and build a shared workspace around your team’s reporting needs.

Baserow 2.4 adds Button fields, Graph elements, workflow automation, AI provider management, improved Group By views, and 30+ more updates.

Discover how Airtable and Baserow compare in features, flexibility, speed, and scalability. Compare pricing plans and hidden costs to make an informed decision!

Explore the best open-source software alternatives to proprietary products. Discover OSS tools, licenses, and use cases with our updated directory.