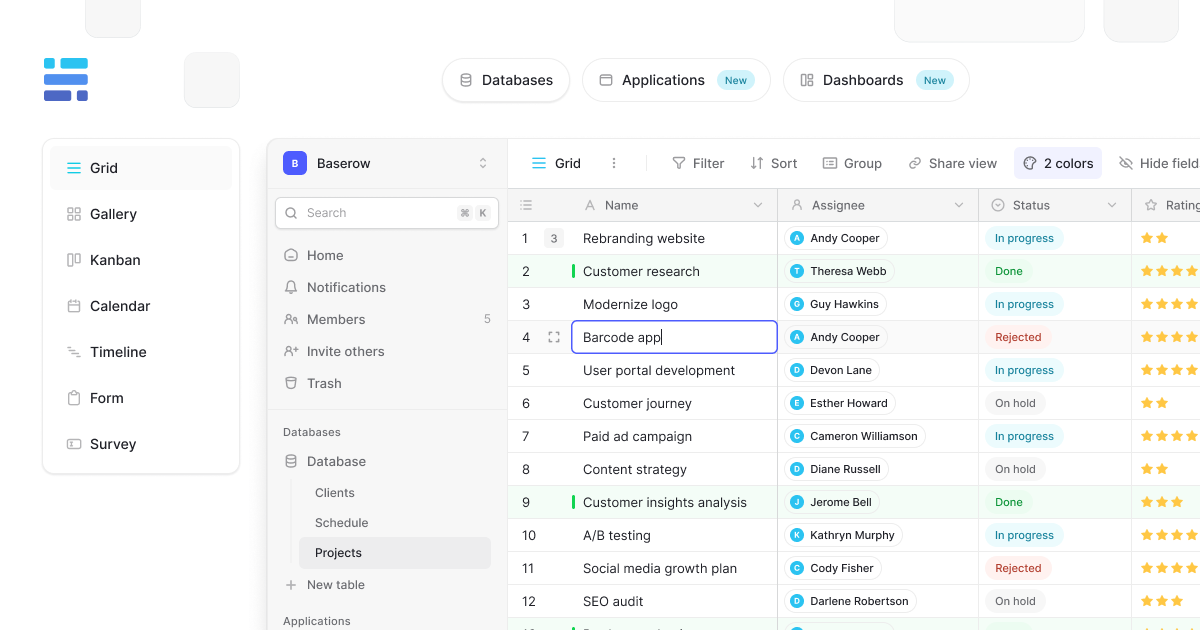
Grid view
Grid view displays your data in rows and columns like a traditional spreadsheet, making it the most versatile view type for detailed data work.
This guide covers how to use Baserow’s Grid view for spreadsheet-style data management, bulk operations, and detailed record editing.
What is Grid view?
Grid view is Baserow’s spreadsheet-style interface for managing data. If you’ve used Microsoft Excel or Google Sheets, Grid view will feel immediately familiar. It’s the default view for all new tables and offers the most comprehensive set of features for data manipulation.
Grid view excels at: Bulk data entry, editing multiple records simultaneously, detailed data analysis, working with formulas and calculations, exporting filtered data, and managing large datasets with precision.
Learn more about views in general: Views overview
Grid view vs other view types
| Feature | Grid | Gallery | Kanban | Calendar | Timeline | Form |
|---|---|---|---|---|---|---|
| Best for | Detailed data work | Visual browsing | Status tracking | Date-based events | Project timelines | Data collection |
| Data density | High | Medium | Low | Medium | Medium | N/A |
| Multi-row selection | ✓ | – | – | – | – | – |
| Manual reordering | ✓ | – | – | – | – | – |
| Field summaries | ✓ | – | – | – | – | – |
| All field types visible | ✓ | Limited | Limited | Limited | Limited | Configurable |
| Bulk editing | ✓ | Limited | Limited | – | – | – |
| Export capability | ✓ | – | – | – | – | – |
Learn more: Gallery view | Kanban view | Calendar view
Create a Grid view
Every new table includes a default Grid view automatically. To create additional Grid views:
- Click the view dropdown at the top-left of the table
- Select Grid from the view type options
- Choose Collaborative or Personal permission type
- Enter a name for your Grid view
- Click Add view

The new Grid view initially displays all table data. Customize it with filters, sorts, and field visibility to create focused views for specific workflows.
Select multiple rows
Grid view’s multi-row selection enables bulk operations on many records simultaneously. This is unique to Grid view; other view types don’t support multi-row selection.
Using checkboxes
- Hover over the row number on the left side of any row
- A checkbox appears, click it to select the row
- Repeat for additional rows to build your selection
- Selected rows highlight with a blue background
Using keyboard shortcuts
- Click a row to select it
- Hold Shift and click another row
- All rows between the first and last selection are selected
- Use Cmd/Ctrl + Click to select non-contiguous rows
Bulk actions
Once rows are selected, a toolbar appears at the top of the grid with available actions:
- Delete rows - Remove all selected rows permanently
- Duplicate rows - Create copies of selected rows
- Export table - Download selected table or views only
Learn more: Multi-cell row selection for pasting
Reorder rows manually
Grid view lets you manually arrange row order by dragging, which is particularly useful when automatic sorting doesn’t match your needs.
Drag handle: Click and hold the drag handle (⋮⋮) on the left side of any row, then drag the row up or down to its new position.

Manual reordering only works when no automatic sorts are applied. If you’ve added sort conditions, remove them first to enable manual reordering.
When you manually reorder rows, your custom order persists until you apply automatic sorting. This makes manual ordering perfect for priority lists, custom workflows, or any scenario where your judgment matters more than field-based sorting.
Adjust column width
Control how much space each field occupies horizontally to optimize your view for the data you’re working with.
Width adjustments save per view, so different Grid views of the same table can have different column widths optimized for their specific purposes.
Freeze columns
When working with wide tables containing dozens of fields, it can be difficult to keep track of which row you are looking at as you scroll horizontally. Baserow allows you to freeze up to four columns on the left side of your Grid view.
These columns stay frozen in place, ensuring that key information remains permanently visible while you scroll through the rest of your dataset.
How to freeze a column
By default, you already have at least one pinned primary field. You will see a thick vertical divider separating pinned columns from the rest of the table. Click and hold a column divider, then drag it to the left side of that divider to freeze it.
How to unpin a column
To unpin a column and return it to the scrollable area of your table, click and drag the column header to the right side of the pinned column divider.
Change the order of columns
You can freeze a column using drag and drop. Click and drag the column headers of your pinned columns to rearrange them, just as you would with standard columns.
Resize individual columns
- Hover over the dividing line between field headers
- Your cursor changes to a resize indicator
- Click and drag left or right to adjust width
- A blue indicator shows the new width as you drag
- Release to set the new width

Field summaries
Field summaries calculate summary statistics for each field, appearing at the bottom of the grid. This feature is unique to Grid view.
Available summaries vary by field type. Field summaries respect active filters. If you filter to show 100 rows out of 1,000, summaries are calculated based only on the visible 100 rows.
To configure summaries, scroll to the bottom of your Grid view. Click the dropdown in the footer row below any field -> Select the summary type you want to display. The calculated value appears immediately
Learn more: Field summaries
Grid view toolbar options
The toolbar at the top of Grid view provides quick access to common operations:
- Filter - Show only records matching specific conditions
- Sort - Order rows by field values automatically
- Group - Organize rows into collapsible sections
- Hide fields - Control which columns appear
- Row height - Adjust row size (short, medium, tall, extra tall)
- Share view - Generate public links or embed codes
- Row colors - Apply conditional formatting
Grid view keyboard shortcuts
Speed up your workflow with keyboard shortcuts:
Learn more: Keyboard shortcuts
Grid view management
Access view management options by clicking the three-dot menu (⋮) next to the view name:
- Export view - Download filtered data as CSV, Excel, JSON, or XML
- Duplicate view - Copy configuration to a new view
- Import file - Add data from CSV, JSON, or XML files
- Convert view type - Change between collaborative and personal
- Webhooks - Configure external notifications
- Rename view - Update the view name
- Delete view - Remove the view
Learn more: View configuration options
Why use Grid view?
Grid view is the most powerful view type for detailed data work. Unlike specialized views (kanban, calendar, gallery) designed for specific use cases, Grid view provides complete access to all your data with maximum flexibility.
Comprehensive data access: See all fields at once without switching between specialized views. Every field type displays in Grid view, from simple text to complex formulas.
Bulk operations: Select and modify multiple rows simultaneously. Perform actions like delete, duplicate, or export on dozens or hundreds of records at once.
Spreadsheet familiarity: Users familiar with Excel or Google Sheets can start working immediately without learning new interfaces. Standard spreadsheet conventions (cell selection, keyboard shortcuts, inline editing) all work as expected.
Advanced features: Grid view uniquely supports field summaries, manual row reordering, multi-row selection, and detailed field width customization that other view types don’t offer.
Frequently asked questions
Why can’t I manually reorder rows in my Grid view?
Manual reordering is disabled when automatic sort conditions are active. Click the Sort button in the toolbar and remove all sort conditions by clicking the X next to each one. Once sorts are removed, the drag handle (⋮⋮) becomes functional for manual reordering.
How many rows can the Grid view handle efficiently?
Grid view performs well with tables containing tens of thousands of rows. For optimal performance with very large tables (100,000+ rows), use filters to reduce visible rows or consider pagination strategies. Field summaries calculate quickly, even on large filtered datasets.
Do field summaries work with filtered data?
Yes. Field summaries are calculated based only on currently visible rows. If you apply filters that show 50 rows out of 500, summaries (sum, average, count) reflect only those 50 visible rows.
Can I copy multiple cells from Excel to Grid view?
Yes. Copy cells from Excel or Google Sheets, click a cell in Grid view, and paste (Ctrl/Cmd + V). Baserow creates or updates rows and fields as needed to accommodate the pasted data. Learn more: Paste data into cells
Why don’t I see the Export option in my view menu?
Export is only available from the Grid view menu (⋮) next to the view name. Other view types (gallery, kanban, calendar) don’t have direct export options. Switch to Grid view or use table export to download data from other view types.
What’s the difference between row height and column width?
Row height (short, medium, tall, extra tall) affects vertical space and how much text displays in cells. Configure it from the view menu. Column width affects horizontal space per field and adjusts by dragging field header borders. Both settings save per view independently.
How many columns can I freeze?
You can pin a maximum of 4 columns per view. This limit ensures that you still have enough screen space to view and horizontally scroll through the rest of your unpinned data.
Does freezing a column affect other users?
Freezing is a view-level setting. If you freeze a column in a Collaborative view, it will remain for all users who access that view. If you freeze it in a Personal view, it will only affect your screen.
Related resources
View basics
- Views overview - Understanding all view types
- Create custom views - Step-by-step view creation
- View configuration options - Filters, sorts, and settings
Grid view features
- Filters in Baserow - Show specific records
- Group rows - Organize with grouping
- Field customization - Hide and reorder fields
- Row configuration - Row height and formatting
- Row coloring - Conditional formatting
- Field summaries - Calculate summaries
Data operations
- Export a view - Download grid data
- Import data - Add records from files
- Paste data - Copy from spreadsheets
- Public sharing - Share grids externally
Other view types
- Gallery view - Visual card display
- Kanban view - Project boards
- Calendar view - Date-based scheduling
- Form view - Data collection
Still need help? If you’re looking for something else, please feel free to make recommendations or ask us questions; we’re ready to assist you.
-
Contact support for questions about Baserow or help with your account
- On this page
- What is Grid view?
- Grid view vs other view types
- Create a Grid view
- Select multiple rows
- Reorder rows manually
- Adjust column width
- Field summaries
- Grid view toolbar options
- Grid view keyboard shortcuts
- Grid view management
- Why use Grid view?
- Frequently asked questions
- Why can’t I manually reorder rows in my Grid view?
- How many rows can the Grid view handle efficiently?
- Do field summaries work with filtered data?
- Can I copy multiple cells from Excel to Grid view?
- Why don’t I see the Export option in my view menu?
- What’s the difference between row height and column width?
- How many columns can I freeze?
- Does freezing a column affect other users?
- Related resources