Timeline view guide
Timeline view displays records as horizontal bars showing duration from start to end date, making it perfect for project roadmaps, resource planning, and any workflow where date ranges matter.
This guide covers how to use Baserow’s Timeline view to visualize project durations, track date ranges, and manage Gantt-style timelines with drag-and-drop scheduling.
Paid feature: Timeline view requires Paid plans. Users on the free plan cannot create timeline views.
Learn more about views in general: Views overview
What is Timeline view?
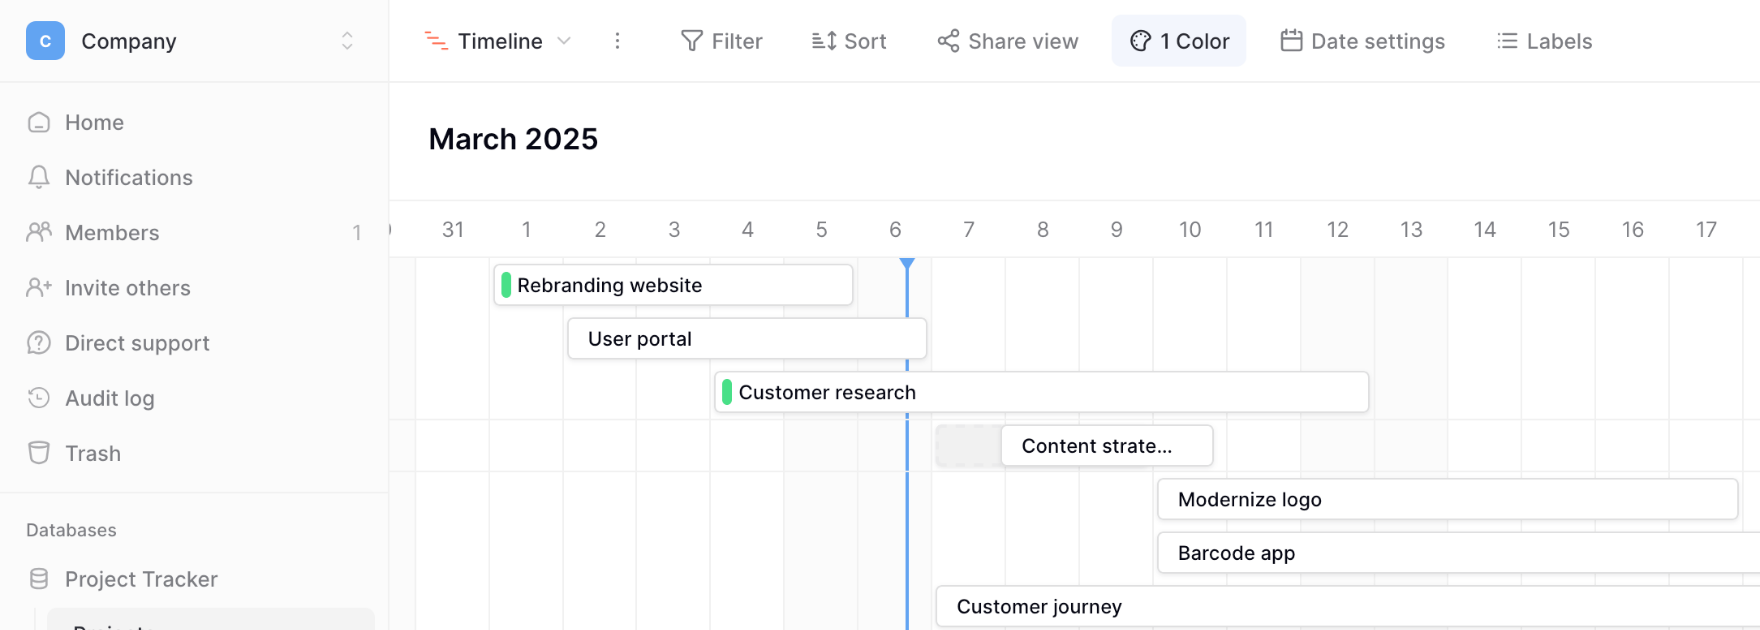
Timeline view shows records as horizontal bars spanning from start date to end date. Unlike Calendar view, which shows events on specific dates, Timeline view emphasizes duration; how long tasks take and how they overlap. This Gantt-style visualization makes project planning and scheduling intuitive.
Timeline view excels at: Project roadmaps and milestones, resource allocation across time periods, multi-phase project planning, campaign timelines with preparation and execution periods, construction or manufacturing schedules, and any workflow where understanding task duration and overlap is critical.

Timeline view vs other view types
| Feature | Timeline | Calendar | Kanban | Grid |
|---|---|---|---|---|
| Best for | Date ranges/durations | Specific date events | Status tracking | Detailed data work |
| Visualization | Horizontal bars | Calendar grid | Status columns | Spreadsheet rows |
| Date requirement | Start & end dates | Single date | Optional | Optional |
| Shows duration | ✓ Bar length | – | – | Text only |
| Shows overlap | ✓ Visual | Partially | – | – |
| Drag to adjust | ✓ Start/end dates | – | ✓ Status only | – |
| Time scale | Flexible zoom | Month/week/day | N/A | N/A |
| Premium feature | Yes | Yes | Yes | No |
Learn more: Calendar view | Kanban view | Grid view
Create a Timeline view
Timeline views require both start and end date fields to display duration bars. This distinguishes Timeline from Calendar view, which only needs one date field.
Prerequisites
Your table must have two date fields:
- Start date field - When tasks/projects begin
- End date field - When tasks/projects complete
If you only have one date field, consider adding an end date field or use Calendar view instead.
Create the view
- Click the view dropdown at the top-left of the table
- Select Timeline from the view type options
- Choose Collaborative or Personal permission type
- Enter a name for the Timeline view
- Select the start date field from your table
- Select the end date field from your table
- Click Create view

Tasks appear as horizontal bars spanning from start to end date. Records with missing start or end dates may not display properly.
Configure date settings
The Date settings button in the toolbar shows which date fields currently define the timeline.
Change date fields
- Click Date settings in the toolbar
- Select different start date field from dropdown
- Select different end date field from dropdown
- Timeline reorganizes with new date configuration

This lets you create multiple Timeline views of the same data with different date perspectives (e.g., “Planned Timeline” using planned dates vs “Actual Timeline” using actual dates).
Navigate the timeline
Timeline controls
Scroll horizontally: Click and drag the timeline or use the scroll wheel to move through time periods
Zoom in/out: Adjust timeline scale to show days, weeks, or months depending on your project scope
Today button: Click Today to jump immediately to the current date
Arrow buttons: Use left/right arrows to navigate between time periods
Interact with taskbars
Drag entire bars: Click and drag task bars left or right to reschedule while maintaining duration
Drag bar edges: Click and drag the left edge to adjust the start date, or the right edge to adjust the end date
Hover for details: Hover over any task bar to see a tooltip with dates and key fields
Click to open: Click any taskbar to open the full record in an edit modal where you can modify all fields or add comments
Drag-to-adjust makes rescheduling intuitive; visually move tasks on the timeline instead of manually editing date fields.
Customize timeline display
Configure task labels
Control which fields display alongside task bars on the timeline.
- Click Labels in the toolbar
- Toggle fields on/off to show or hide them on task rows
- Use Hide all or Show all for quick bulk changes
- Drag the handle (⋮⋮) to reorder fields
- Use the search box to find fields quickly

Green toggles (switched right) indicate visible fields. Gray toggles (switched left) indicate hidden fields.
Label strategy: Show essential information like task names, owners, and progress indicators. Hide administrative fields. Put the most important fields first for quick scanning.
Apply task colors
Use row coloring to color-code task bars based on field values, making different project phases, teams, or priorities visually distinct.
- Click Colors in the toolbar
- Click Add condition
- Select a field and condition (e.g., “Priority = High”)
- Choose a color for matching tasks
- Add multiple conditions with different colors
Timeline view toolbar options
The toolbar at the top of the Timeline view provides quick access to common operations:
Filter - Show only tasks matching specific conditions. Useful for viewing specific projects, team members, or date ranges.
Sort - Order task rows by field values (priority, owner, start date). Sorting doesn’t affect bar positions on the timeline; those are always determined by dates.
Share view - Generate public links or embed codes to share timelines externally.
Colors - Apply conditional formatting to task bars (covered above).
Date settings - Configure start and end date fields (covered above).
Labels - Customize which fields appear on task rows (covered above).
Timeline view management
Access view management options by clicking the three-dot menu (⋮) next to the view name:
- Duplicate view - Copy configuration to a new view
- Import file - Add data from CSV, JSON, or XML files
- Convert view type - Change between collaborative and personal
- Webhooks - Configure external notifications for timeline events
- Rename view - Update the view name
- Delete view - Remove the view permanently
- Configure date dependencies - Set up relationships between date fields
Learn more: View configuration options
Why use Timeline view?
Timeline view provides duration-based visualization that’s impossible in Grid view or Calendar view. The horizontal bar layout makes task length and overlap immediately visible.
Duration clarity: See how long each task takes at a glance. Long bars indicate extended projects, short bars show quick tasks. This visual length makes planning more intuitive than reading date fields.
Overlap identification: Spot conflicting schedules or resource conflicts where multiple tasks overlap the same time period. Timeline view makes these conflicts visually obvious.
Drag-to-reschedule: Click and drag task bars to adjust start and end dates directly on the timeline. No field editing required; visual scheduling matches mental models for time management.
Scrollable timeline: Navigate across weeks, months, or years by scrolling and zooming. See short-term details or long-term project arcs by adjusting the timeline scale.
Frequently asked questions
What’s the difference between Timeline view and the Calendar view?
Calendar view shows events on specific dates in a monthly grid. Timeline view shows duration bars from start to end date. Use a calendar for events (meetings, deadlines). Use a timeline for tasks with duration (projects, campaigns, development phases).
Can I use Timeline view with only one date field?
No, Timeline view needs start and end dates to show meaningful duration bars. Consider adding an end date field or using a Calendar view instead.
How do I handle tasks without end dates?
Tasks with missing end dates may not display properly on the timeline. Options: (1) Add estimated end dates, (2) Use a formula field to calculate end dates from start dates plus duration, (3) Filter out incomplete records, or (4) manually assign placeholder end dates.
Can I drag tasks to reschedule them?
Yes. Click and drag entire task bars to move them while maintaining duration. Drag the left edge to adjust the start date or the right edge to adjust the end date. These visual adjustments update the underlying date fields immediately.
Why don’t my changes appear for other users immediately?
Timeline views update in real-time when records change. If other users don’t see updates immediately, they may need to refresh their browsers. Collaborative views share configurations, but a browser refresh may be needed to see data changes.
How do I see tasks that overlap?
Overlapping tasks appear as stacked bars in Timeline view. If multiple tasks run during the same time period, they stack vertically in their rows. Use filters or sorts to identify conflicts, or color-code by resource/person to spot over-allocation.
Can I export Timeline view data?
Timeline view doesn’t have direct export. Switch to grid view to access export functionality, or use table export to download all data, including dates. The export contains the same data; only the access point differs.
What’s the maximum timeline duration I can display?
Timeline view can display any date range from days to years. Very long timelines (multi-year projects) may require significant scrolling. Use zoom controls to adjust the scale; zoom out for big-picture views, zoom in for detailed scheduling.
Related resources
View basics
- Views overview - Understanding all view types
- Create custom views - Step-by-step view creation
- View configuration options - General view settings
Timeline features
- Date and time fields - Required for timeline views
- Formula field overview - Calculate dates
- Row coloring - Color-code tasks
- Filters in Baserow - Show specific tasks
- Public sharing - Share timelines externally
Related features
- Row configuration - Open detailed task view
- Row commenting - Add task comments
Other view types
- Calendar view - Single-date events
- Grid view - Spreadsheet interface
- Kanban view - Status-based tracking
- Gallery view - Visual browsing
Plans and features
- Pricing plans - Feature availability by plan
Still need help? If you’re looking for something else, please feel free to make recommendations or ask us questions; we’re ready to assist you.
-
Contact support for questions about Baserow or help with your account
- On this page
- What is Timeline view?
- Timeline view vs other view types
- Create a Timeline view
- Configure date settings
- Navigate the timeline
- Customize timeline display
- Timeline view toolbar options
- Timeline view management
- Why use Timeline view?
- Frequently asked questions
- What’s the difference between Timeline view and the Calendar view?
- Can I use Timeline view with only one date field?
- How do I handle tasks without end dates?
- Can I drag tasks to reschedule them?
- Why don’t my changes appear for other users immediately?
- How do I see tasks that overlap?
- Can I export Timeline view data?
- What’s the maximum timeline duration I can display?
- Related resources