Visualize Power BI data in Baserow
You’ve built a database in Baserow. Your data is organized, your workflows are automated, and everything is running smoothly. But now you need to visualize that data in Power BI dashboards.
Use Cases: When to connect Baserow to Power BI
- Executive dashboards: High-level views of project status and resource allocation. If your team manages projects in Baserow, but executives want a visual dashboard, connect Baserow to Power BI to create real-time project status dashboards so leadership can get insights.
- Multi-source data analysis: If you have data in Baserow, Excel, and SQL Server that needs combined analysis, Power BI pulls from all three sources and creates unified reports.
- Automated reporting: Visualize pipeline value and conversion rates from your Baserow CRM. For cases where you currently export Baserow CSVs weekly to create reports, API connection with scheduled refresh eliminates manual exports.
- Client-Facing Reports: When you need to share polished visualizations with clients, embed Power BI reports in your website or send PDF reports.
- Compliance and Audit Tracking: When you track compliance data in Baserow and need audit-ready reports, Power BI generates standardized, timestamped reports from Baserow data.
- Inventory Tracking: Monitor stock levels and trigger visual alerts when supplies run low.
This comprehensive guide will walk you through every step of connecting Baserow to Power BI using the Web API, from obtaining your API token to setting up automated refreshes.
By the end, you’ll have:
- A live connection between Baserow and Power BI
- Real-time data visualization of your Baserow databases
- Automated refresh schedules that keep your dashboards current
- A deep understanding of how the integration works (and its limitations)
Let’s transform your Baserow data into compelling visual insights.
Integration Architecture
Before diving into the setup, let’s understand what’s actually happening when you connect Baserow to Power BI.
Baserow does not push data to Power BI. Power BI pulls data from Baserow. You control exactly what data comes through using URL parameters.
Baserow Database (the data source)
    ↓
REST API Endpoint (returns JSON)
    ↓
Power BI Web Connector (fetches data)
    ↓
Power Query Editor (transforms JSON to tables)
    ↓
Power BI Data Model (ready for visualization)
Prerequisites
- **Baserow Account** (Cloud or Self-Hosted): Access to the workspace containing the target database.
- Power BI Desktop (latest version recommended)
- Basic understanding of databases (tables, rows, columns, relationships)
- Connection: Web API (REST)
- Auth: Database Token (API Key)
Step-by-Step Implementation
The Web connector requires manual configuration. You need to construct the correct API endpoint URLs, provide authentication headers, transform the JSON response structure, handle pagination for large datasets, and manage refresh credentials.
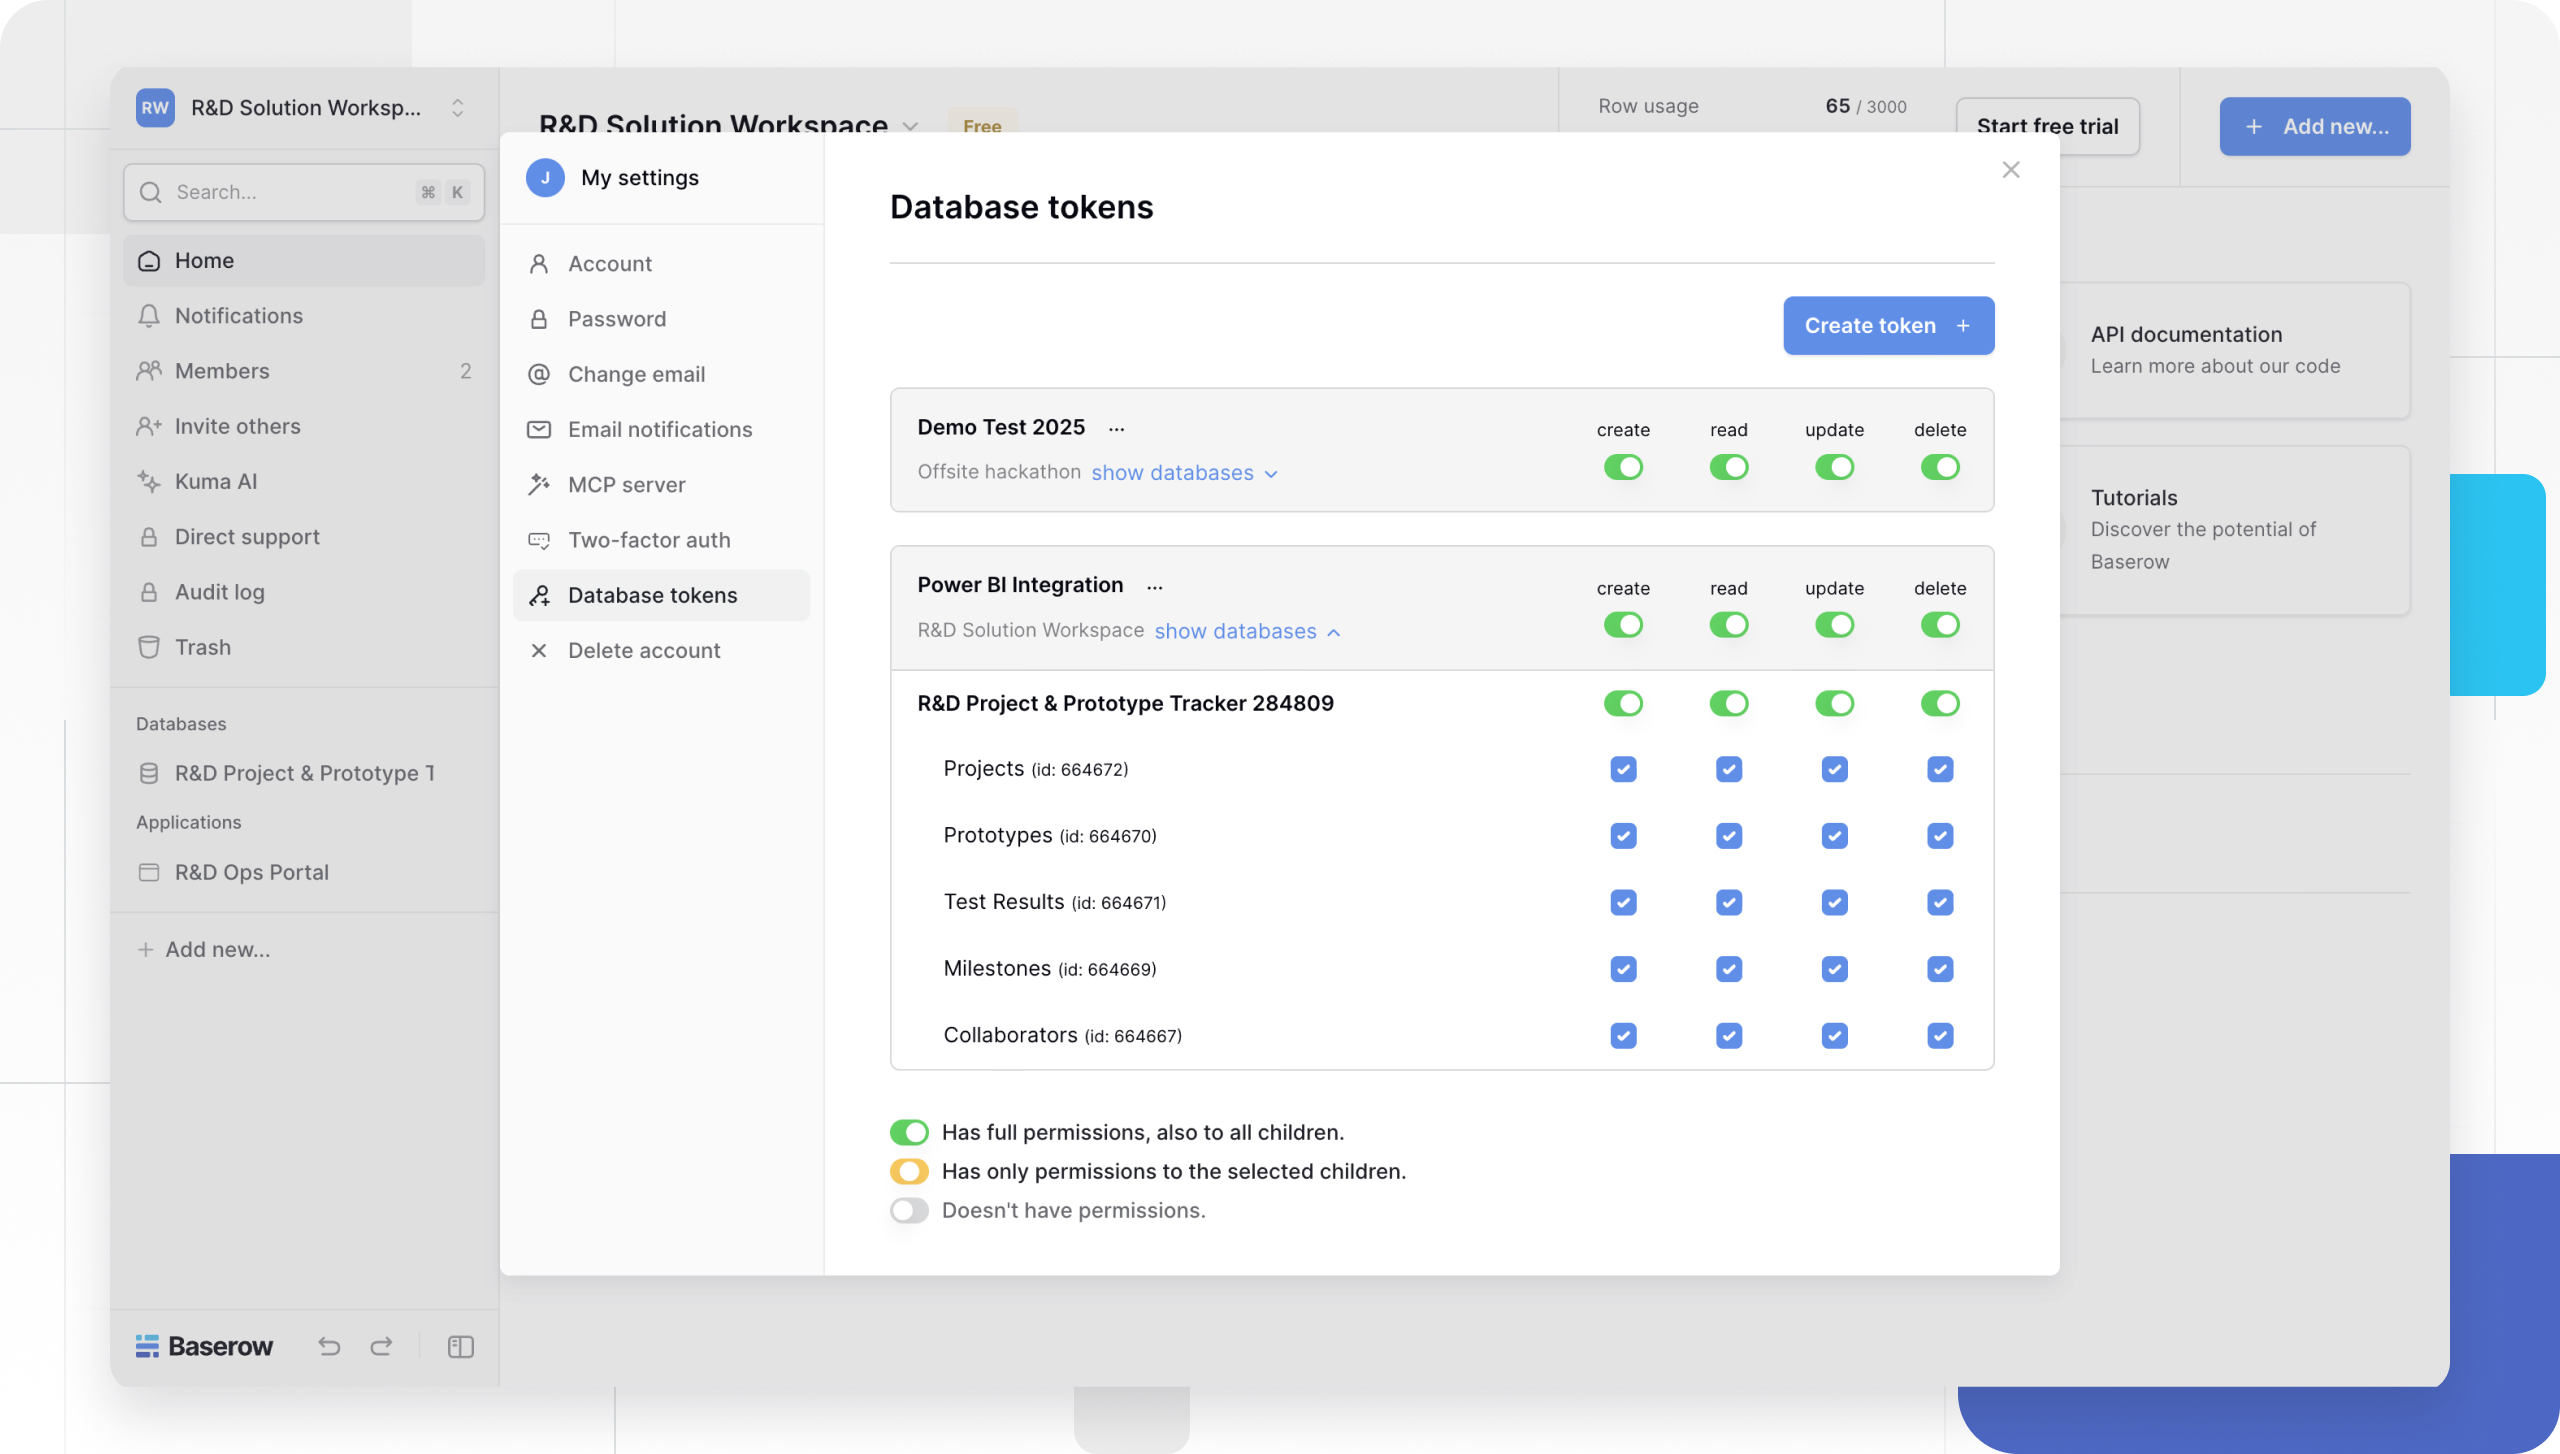
Step 1: Generate a Database token
A Database token acts as a security key, proving permission to access specific Baserow databases and tables.
To generate a database token:
- Log in to Baserow. Click your profile icon (top-right)
- Navigate to Settings → Database tokens.
- Click + Create token.
- Select the workspace and give your token a descriptive name:
Power BI Integration - Scope: Choose which tables this token can access. Select only the tables you need to visualize in Power BI.
- Set permissions:
- Create rows: Optional (only if pushing data from Power BI)
- Read rows: ✓ Required
- Update rows: Optional
- Delete rows: Usually not needed
- Once created, a long string appears (e.g.,
eyJ0eXAiOiJKV1QiLCJh...). Click the “Copy” icon
Learn more about Baserow database tokens.
Database tokens can grant access to your Baserow data. If this token is compromised, your data is at risk.
Step 2: Construct the Endpoint URL
Power BI needs a specific address to call. To list rows in a table, a GET request has to be made to the table endpoint.
The standard format is:
https://api.baserow.io/api/database/rows/table/[TABLE_ID]/
Learn more about the anatomy of a Baserow API Endpoint.
To get the Table ID, open your table in the browser. Look at the URL: https://baserow.io/database/15/table/4567/519, the Table ID is 4567.
Learn more about multiple ways to find a Table ID.
Query parameters:
The response is paginated, and by default, the first page is returned. The correct page can be fetched by providing the page and size query parameters.
Add these parameters to your endpoint URL using ?parameter=value¶meter2=value2 format.
user_field_names=true: Returns “Client Name” instead of “field_124”.size=200: This defines how many rows should be returned per page. The default is 100
We will cover pagination and field names in futher sections.
The Final URL will look like this:
https://api.baserow.io/api/database/rows/table/4567/?user_field_names=true&size=200
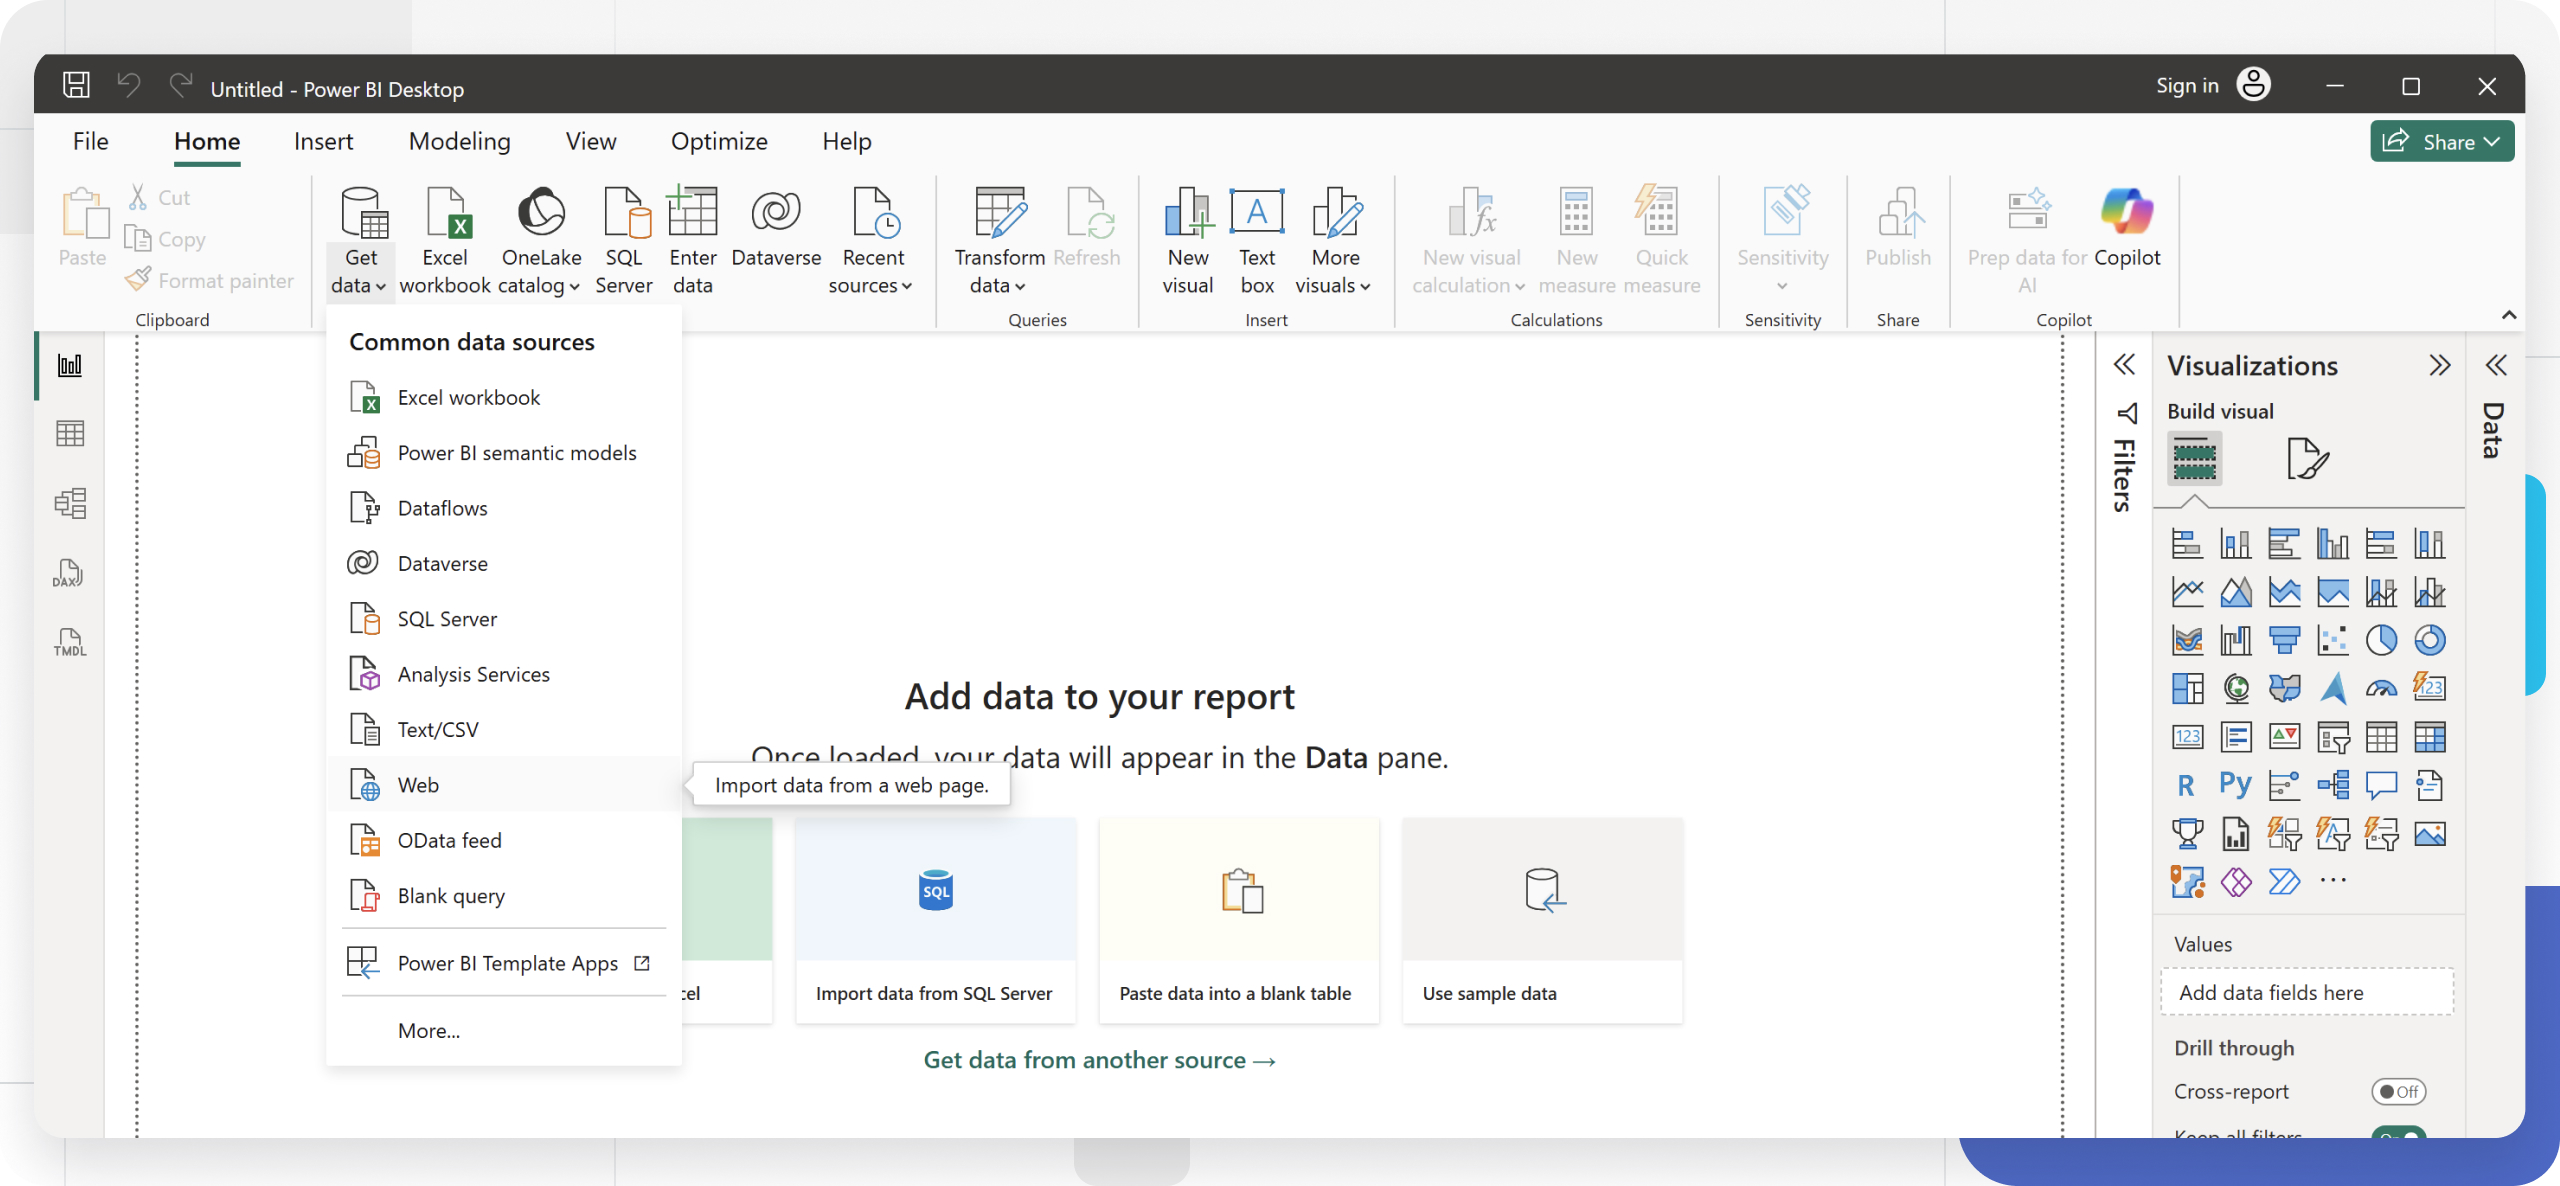
Step 3: Connect Power BI to Baserow via Web Connector
Now that we have the API token and endpoint URL, let’s connect Power BI.
Power BI’s Web connector makes HTTP requests to Baserow’s API endpoints and retrieves the data.
-
Open Power BI Desktop. Start with a blank report or open an existing one.
-
In the Home group of the Power BI Desktop ribbon, select the Get data button label or down arrow to open the Common data sources list.
-
Select Web Connector: In the Get Data dialog, search and select “Web” from the list. Click Connect.
-
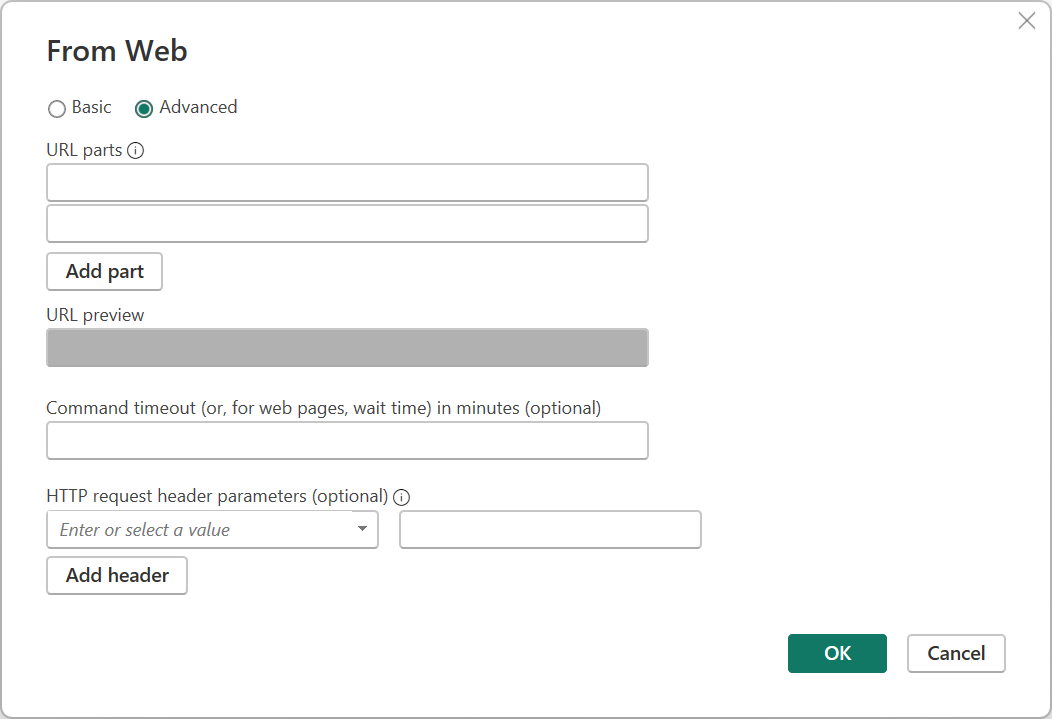
A connection window appears. In “From Web” dialog, switch the radio button to Advanced.
-
URL parts: Paste your endpoint URL (
https://api.baserow.io/...). Click OK.If you need to add more than one part, select Add part to add another URL fragment text box. As you enter each part of the URL, the complete URL used is displayed in the URL preview box.
-
The default timeout for both
POSTandGETis 100 seconds. If this timeout for processing data is too short, you can use the optional Command timeout in minutes to extend the time the request remains connected to Baserow. -
HTTP request header parameters:
-
Key: Select
Authorizationfrom the dropdown (or type it). -
Value: Enter
Token [YOUR_DATABASE_TOKEN]in the box next to it.You must include the word “Token” followed by a space before the actual database token.
-
-
Click OK.
If authentication succeeds, Power Query Editor opens showing a preview of your data.
After the first connection, Power BI remembers your credentials. To edit them later, naviaget to: Home → Transform Data → Data source settings. Find your Baserow API URL in the list and click “Edit Permissions”. Under “Credentials,” click “Edit”. Update your API token if it changed. Click “OK”.
Step 4: Clean the Table
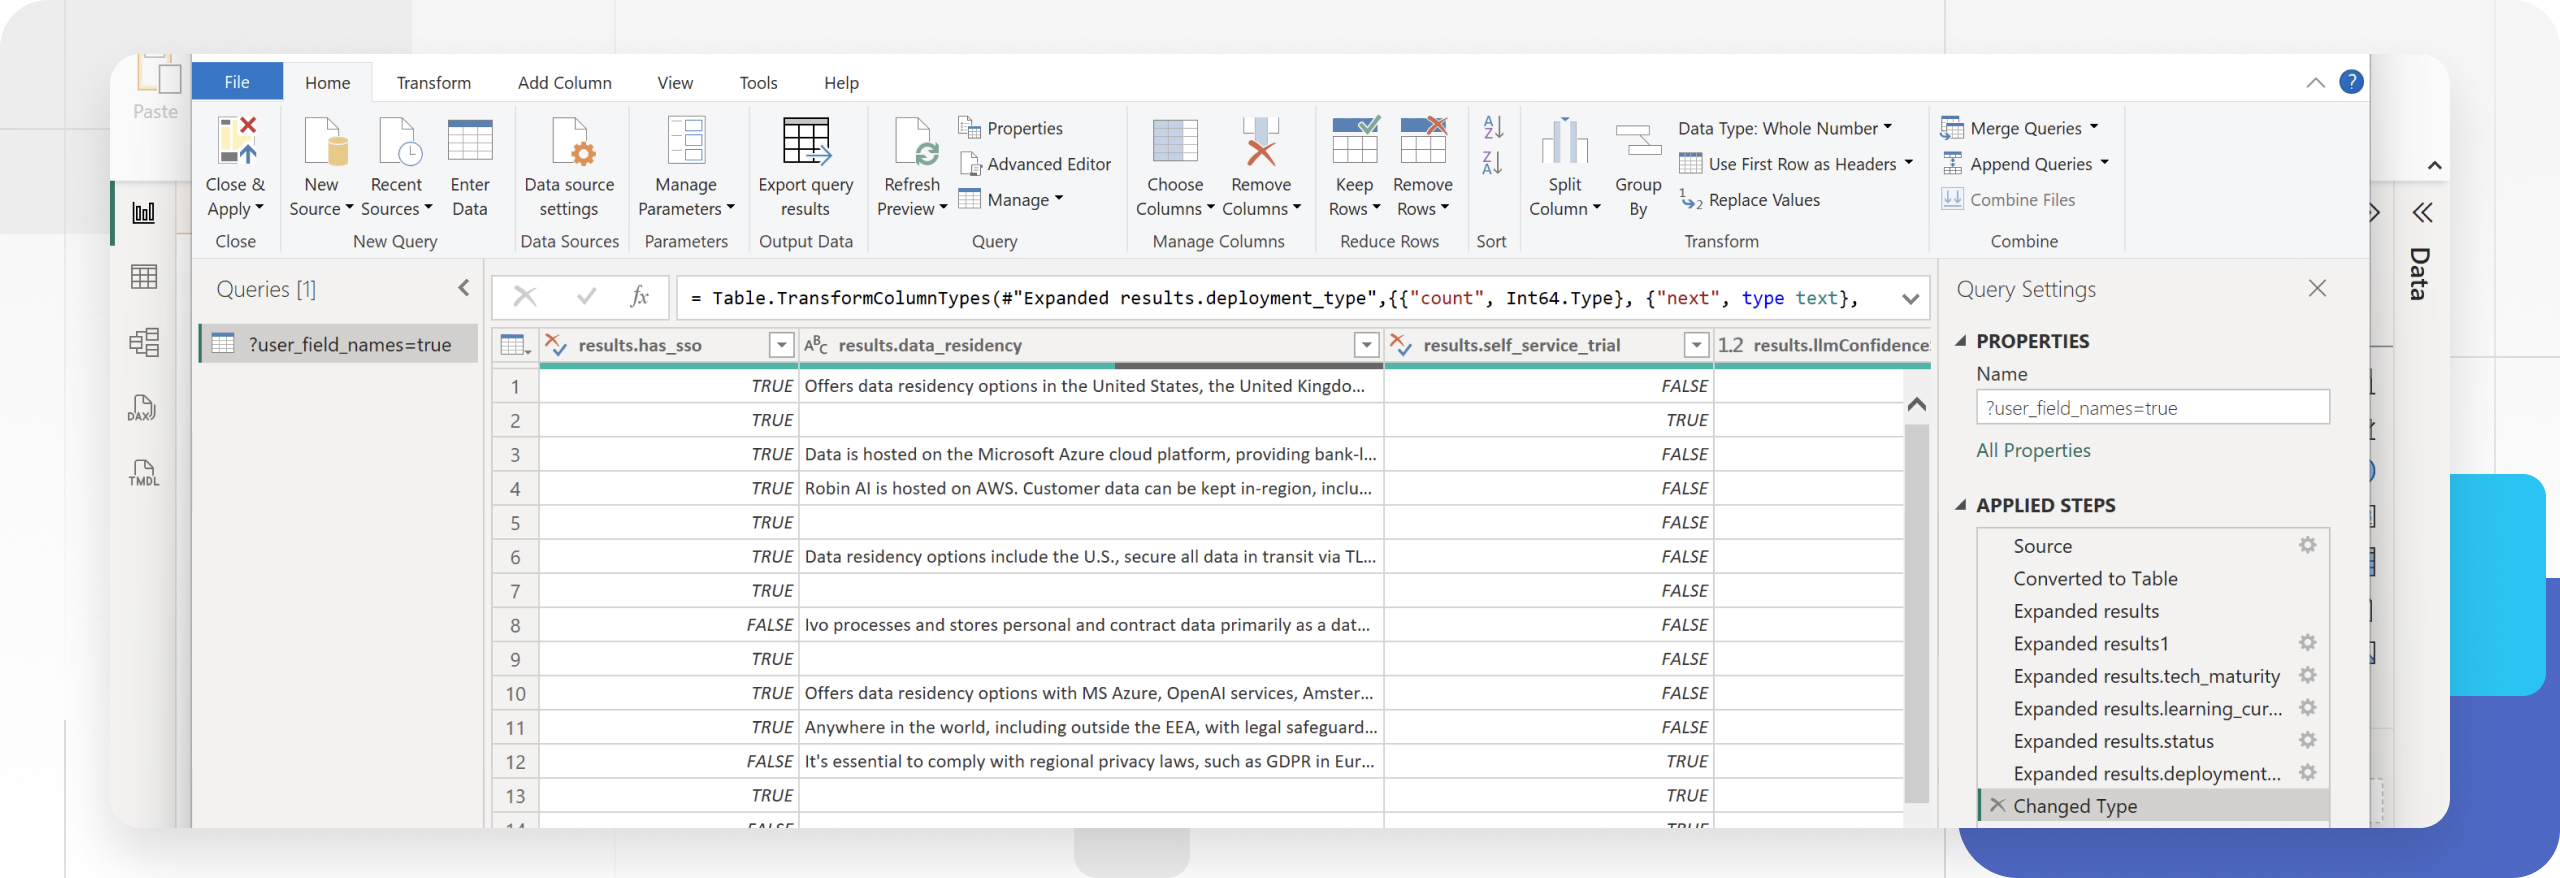
After evaluating query, you will see the Power Query Editor. Power Query converts the JSON response from Baserow into tabular format that Power BI can visualize.
If Power Query shows the JSON as a record with fields, transform it into a proper table structure.
Since Power BI auto-expanded the data, you need to tidy up the view:
-
Remove Unnecessary Columns: Unless you are writing a script to loop through pages, the
count,next, andpreviouscolumns are now duplicates. Right-click thenextcolumn header and select Remove. Do the same forpreviousandcount. -
Rename Columns: Your data columns may have the prefix
results.(e.g.,results.id). Double-click the header, type the new name and click Enter. Repeat for other fields to make them readable. -
Filter Rows: If you only need specific rows, click the filter dropdown on any column header. Uncheck values you want to exclude or use “Text Filters” / “Number Filters” for complex conditions.
We will cover API-level filtering in futher sections.
Step 5: Set Correct Data Types
Power Query auto-detects data types. For each column, click the data type icon in the column header to confirm the correct type.
Go to the Transform ribbon and set the types for critical columns like dates and numbers to avoid calculation errors.
Common Conversions:
- Text: For names, descriptions, IDs stored as text
- Whole Number: For counts, ratings, integers
- Decimal Number: For prices, percentages, decimals
- Date: For date-only fields (no time).
- Date/Time: For timestamps. Power Query handles this automatically if you select “Date/Time” type.
- True/False: For boolean/checkbox fields
We cover Baserow field types and Power BI translation below.
If Power BI outputs a JSON object, not a table. You must use Power Query to translate it.
Multiple Select Fields (comma-separated):
Single Select / Multiple Select comes in as a List or Record. For Multiple Select Fields, if the
API returns: ["Option 1", "Option 2", "Option 3"]
- For Single Select: Click the Expand icon to get the
value. - For Multi Select: Power BI’s Power Query Editor recognizes the nested list structure returned by the Baserow API. Click “Expand to New Rows” first, then expand to get the
value. Power BI automatically creates a new row for every item in the list while duplicating the original main record’s data.
File Fields (extract first URL)
Files/Images returns a list of file objects. In Power Query, add a Custom Column to extract just the URL of the first image:
// Get first file URL= Table.AddColumn(Source, "File_URL", each
    try [file_field]{0}[url] otherwise null)
You can track the applied steps under Query Settings and delete a step if needed.
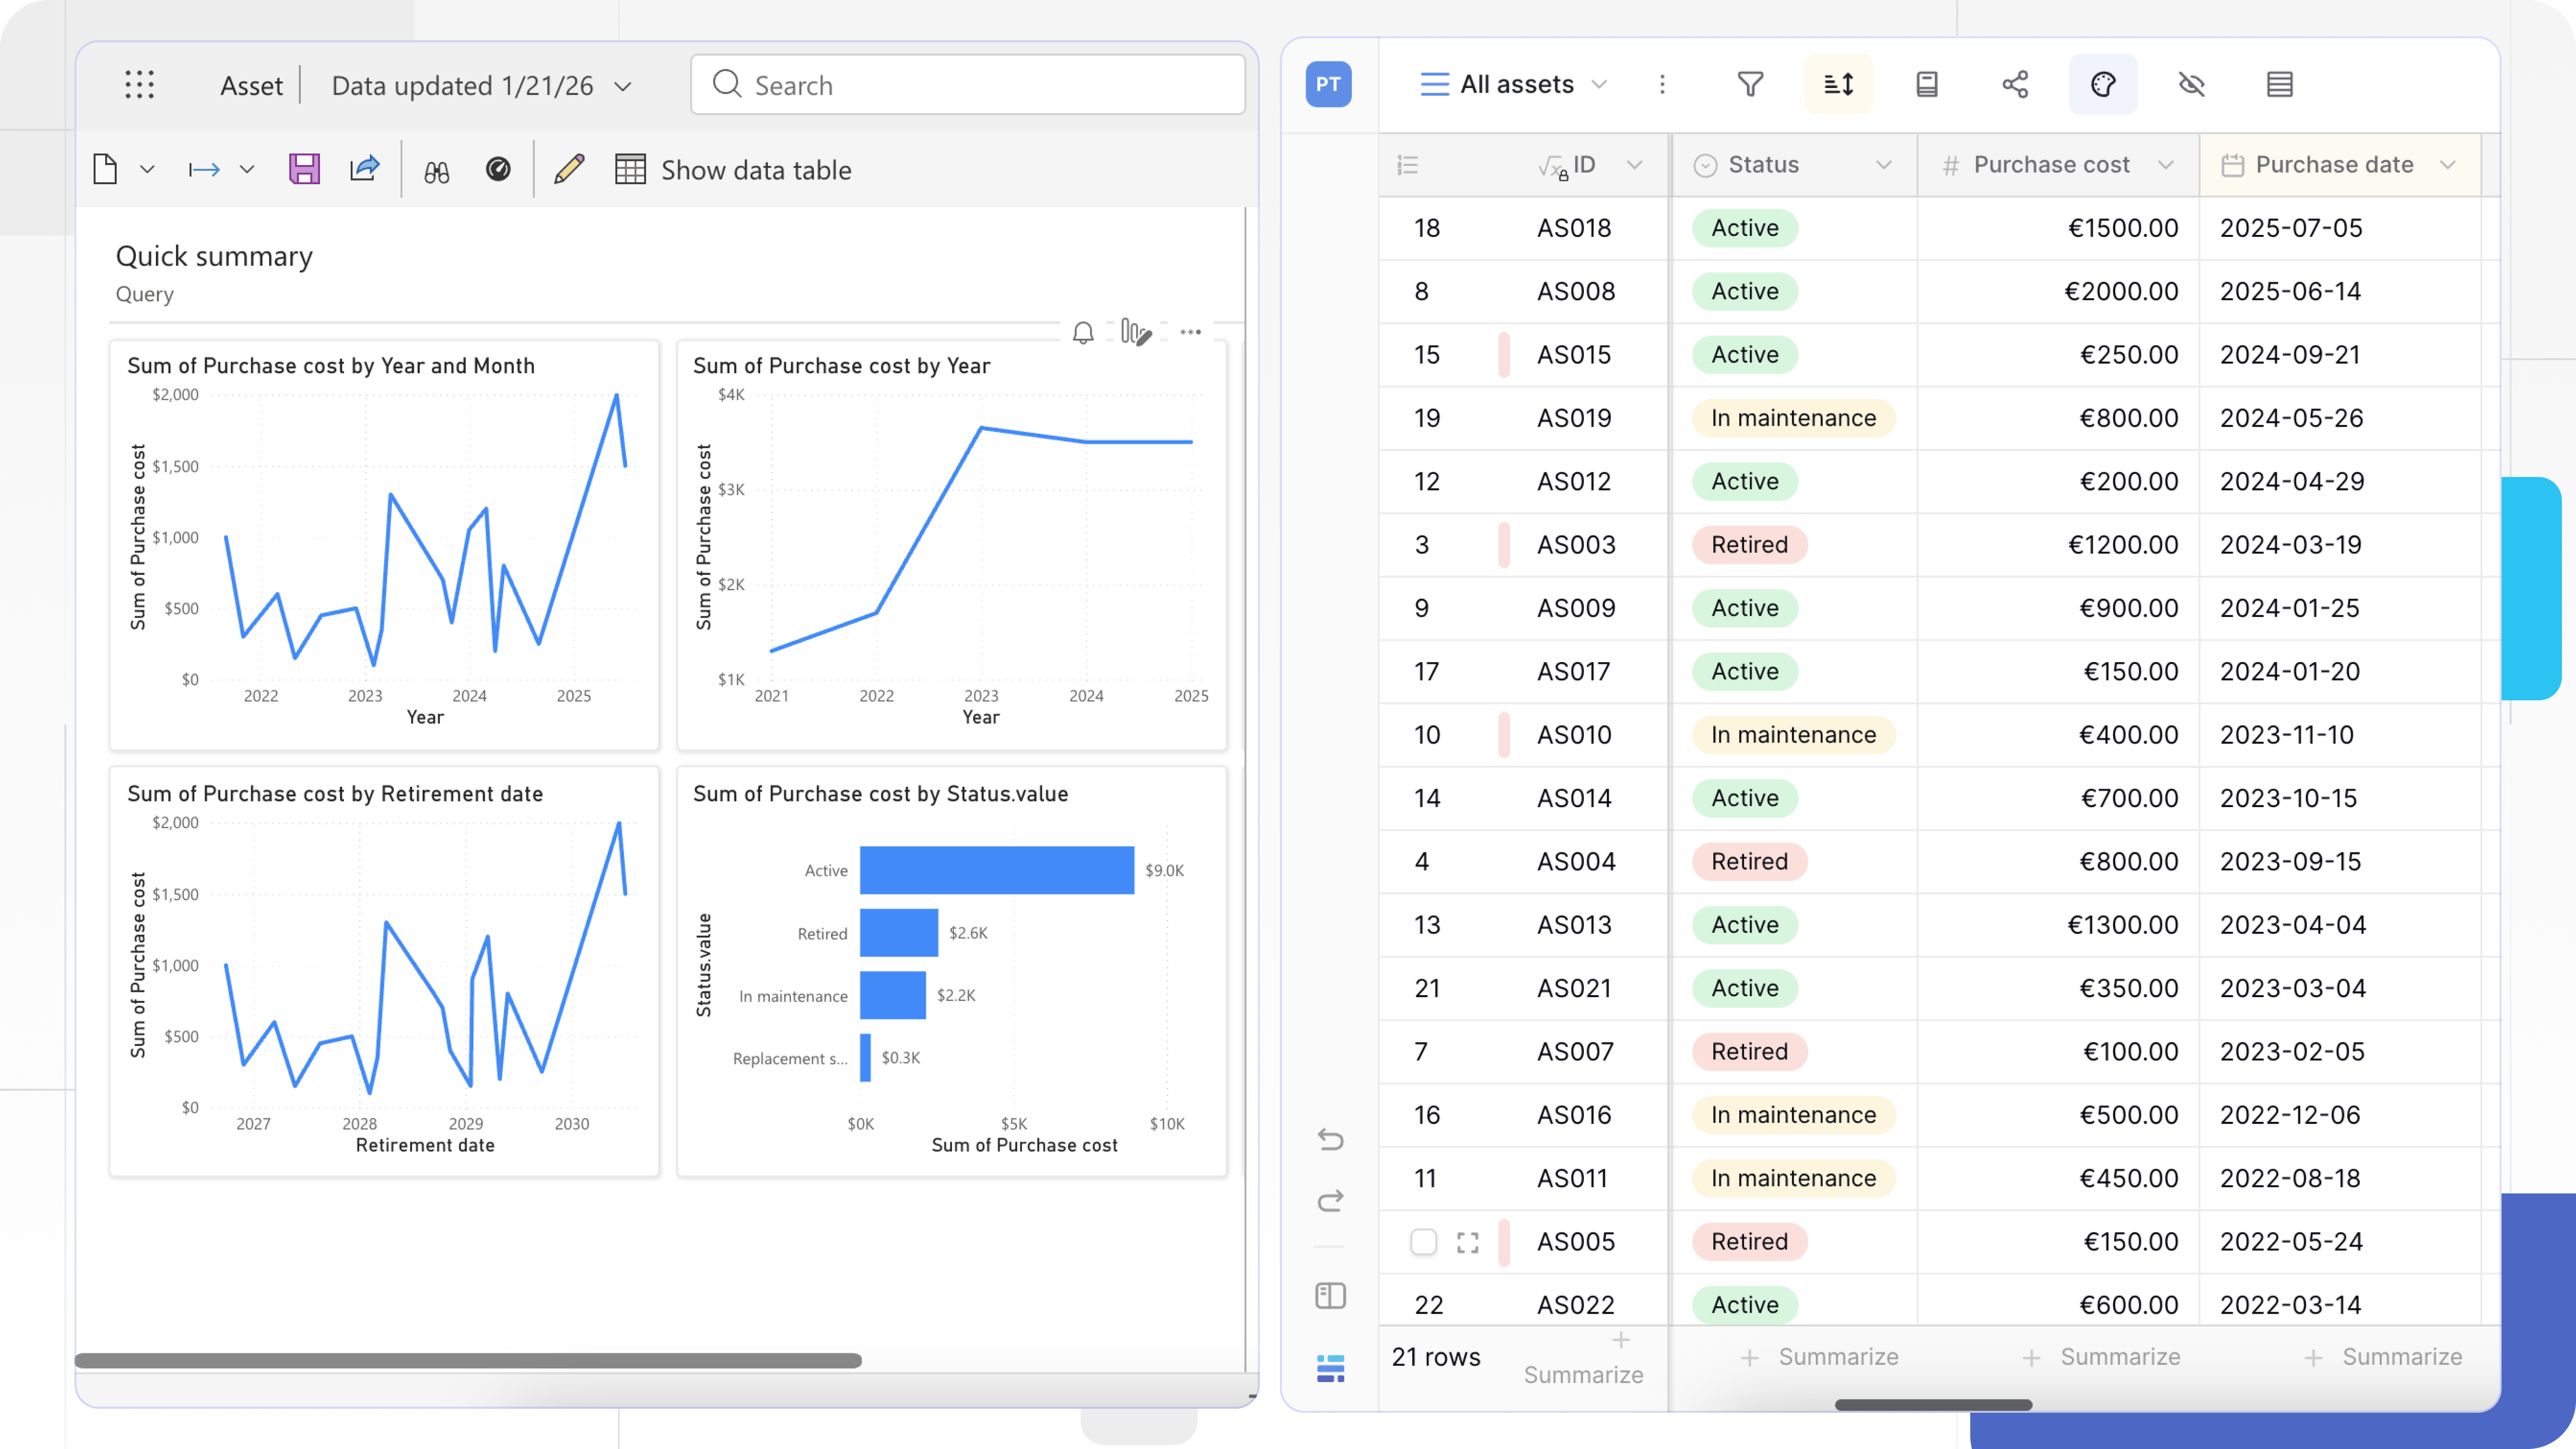
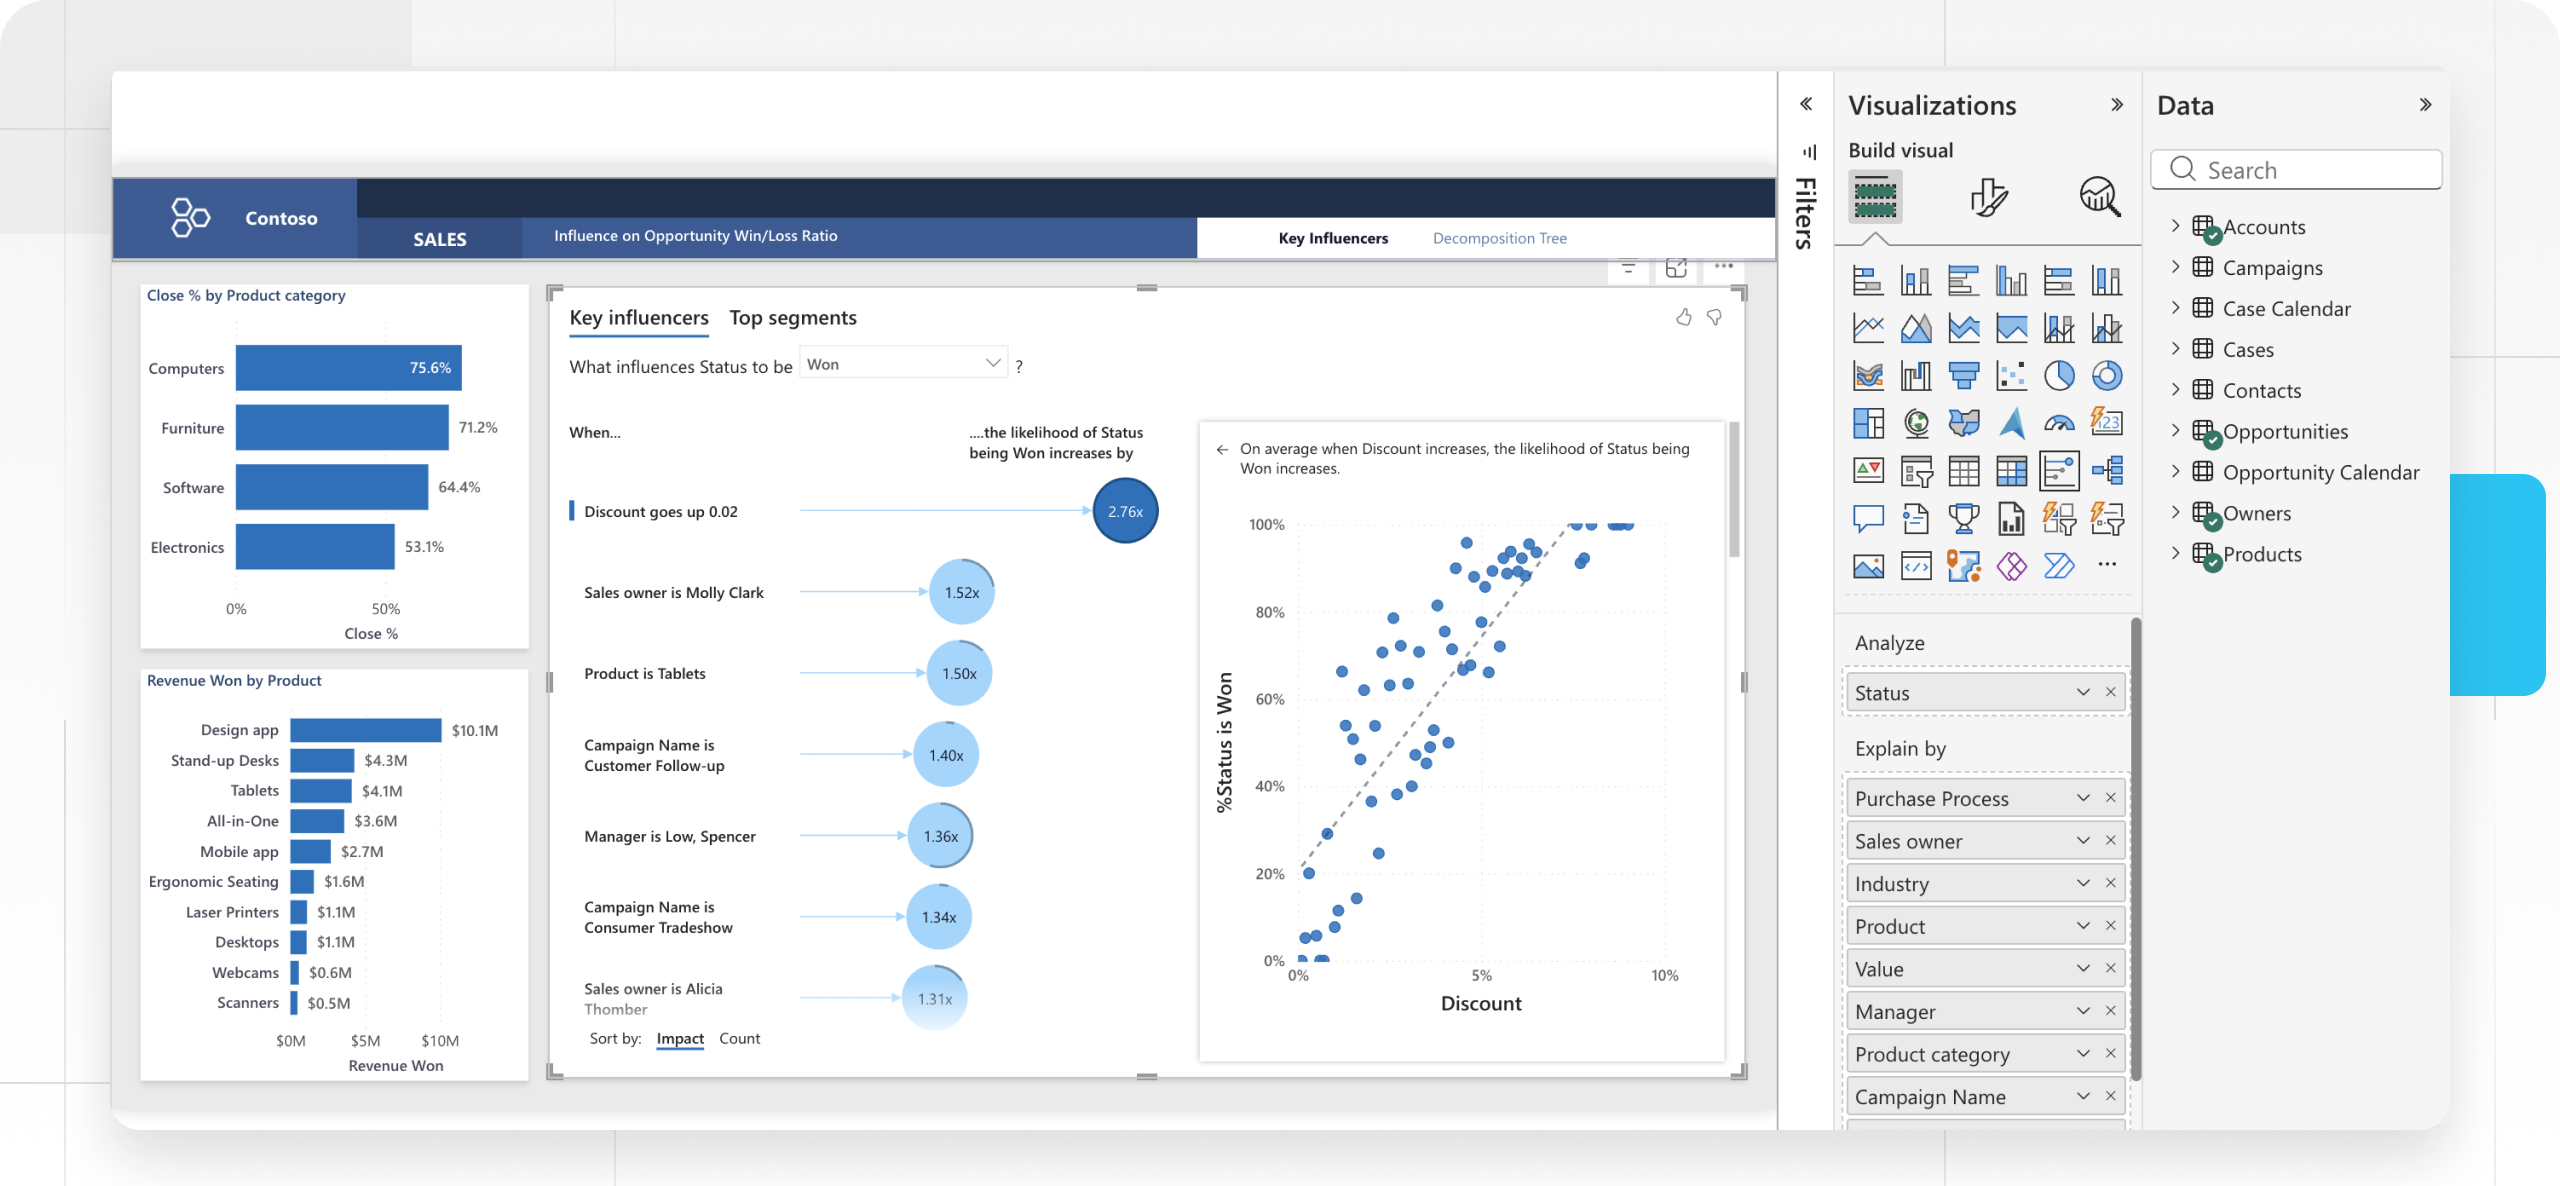
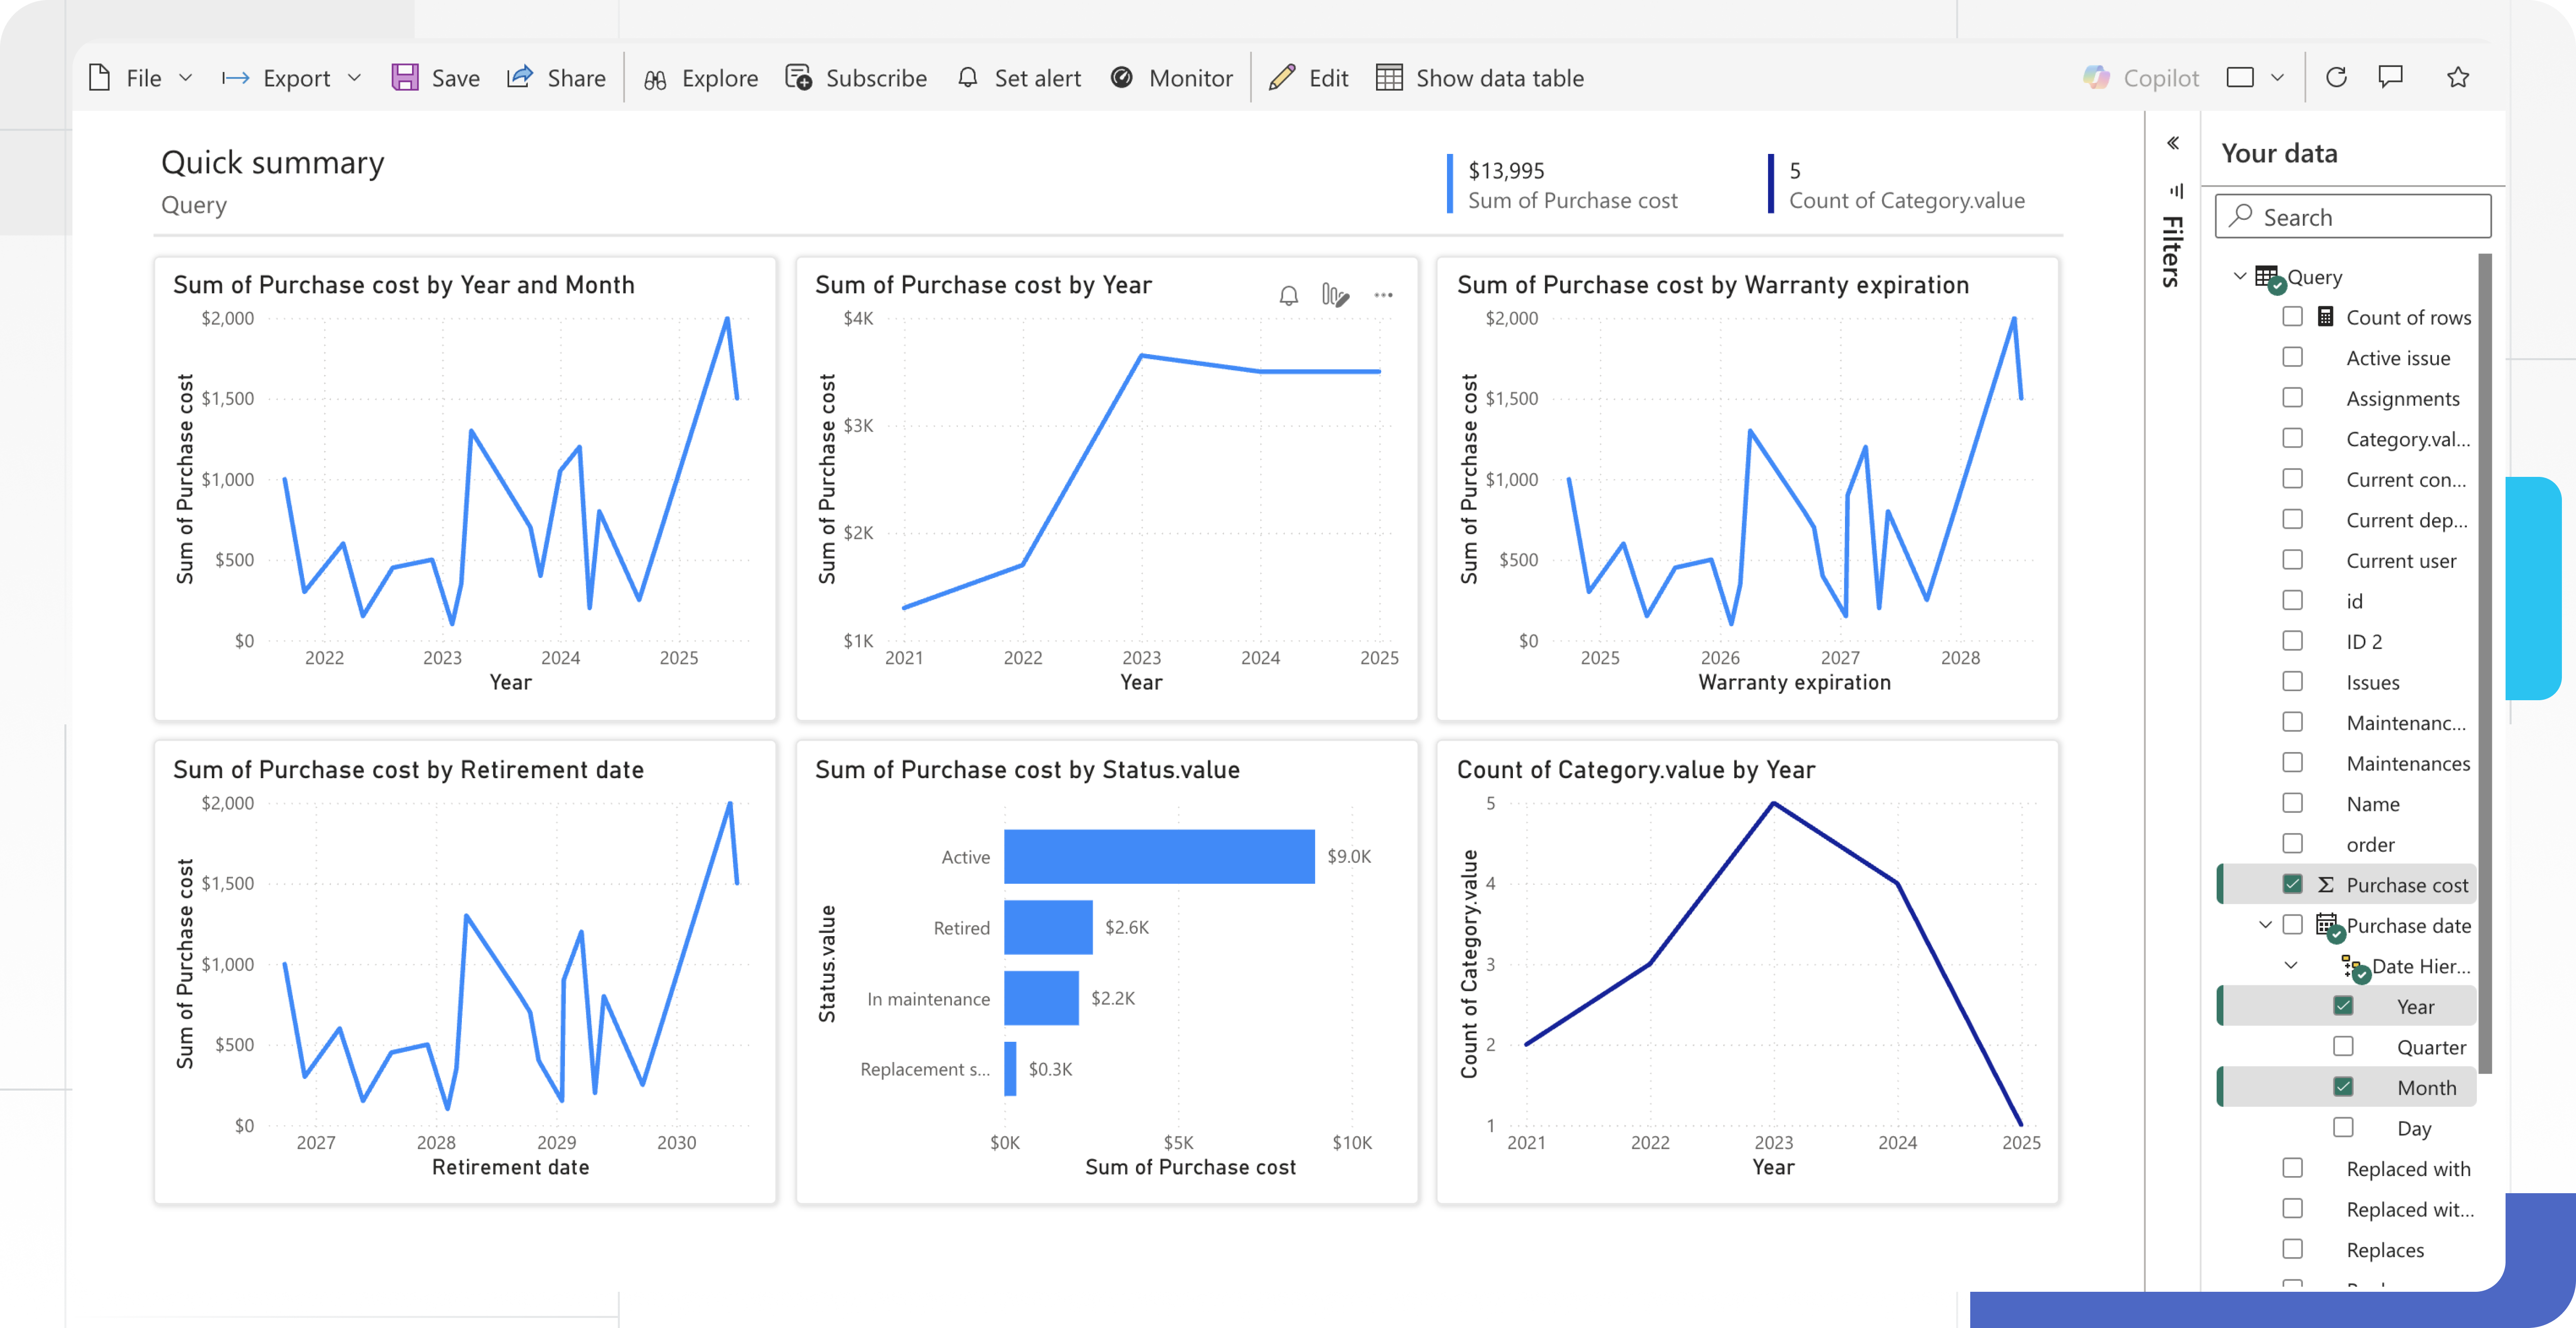
Step 6: Build visuals with your Baserow data
Once your data is transformed in Power Query:
- In the Power Query Editor, click Close & Apply (top left).
- The window will close, and you will see a blank white report canvas.
- On the far right Data pane, you will see your Baserow data ready for visualization. Power BI loads the transformed data into your data model.
- Select or drag a field from the Data pane (like
countorstatus) onto the report canvas. It will instantly turn into a chart. - Building a Chart:
- Click on a Bar Chart icon in the Visualizations pane.
- Drag your Status field into the “X-Axis”.
- Drag your ID field into the “Y-Axis” and right-click it to select “Count”.
- Result: You now have a live chart showing how many projects you have in every status. Every time you hit “Refresh,” this bar chart updates to match Baserow.
Handling Pagination
If your Baserow table has more than 100 rows (or your specified size parameter), the API returns results in pages. You need to fetch all pages.
Baserow API returns maximum 200 rows per request. If you have 1,000 rows, you need 5 requests and need to consider performance.
Manual Pagination (Simple Method)
For small datasets (<1,000 rows), you can simply increase the page size:
https://api.baserow.io/api/database/rows/table/12345/?user_field_names=true&size=200
Automatic Pagination (Advanced Method)
If you have 1,000 rows, the standard method above only gets the first 200. You need a loop to automatically follow the next URL until all data is retrieved.
Use Power Query M Code in the Advanced Editor to automatically fetch all pages. The M Code will connect to the JSON, loop through the pages, combine them into a list, and convert that list into the final table.
-
In Power Query, go to Home → Advanced Editor. The code appears in a text editor
-
Replace the existing code with this script:
let // 1. CONFIGURATION // Your Baserow URL (Ends with a slash) // If using SaaS: "https://api.baserow.io/" BaseUrl = "https://api.baserow.io/", // The path to your table. Replace [YOUR_TABLE_ID] with the actual ID (e.g., 5653) // Note: Do not put query parameters (?size=200) here. RelativePathStart = "api/database/rows/table/[YOUR_TABLE_ID]/", // Replace with your actual Token Token = "Token [YOUR_API_TOKEN]", // 2. FETCH FUNCTION // We use 'RelativePath' to satisfy Power BI Service security rules FetchPage = (relPath) => let Source = Json.Document(Web.Contents(BaseUrl, [ RelativePath = relPath, Headers = [Authorization=Token] ])), results = Source[results], nextURL = Source[next] in {results, nextURL}, // 3. RECURSIVE LOOP FetchAllPages = (relPath) => let page = FetchPage(relPath), results = page{0}, nextURL = page{1}, // Logic: If there is a next link, strip the BaseUrl to get just the relative path newRelPath = if nextURL <> null then Text.Replace(nextURL, BaseUrl, "") else null, nextResults = if newRelPath <> null then @FetchAllPages(newRelPath) else {} in List.Combine({results, nextResults}), // 4. EXECUTION // We add the parameters here (size=200 ensures fewer requests) SourceList = FetchAllPages(RelativePathStart & "?user_field_names=true&size=200"), // 5. CONVERSION TO TABLE #"Converted to Table" = Table.FromList(SourceList, Splitter.SplitByNothing(), null, null, ExtraValues.Error), FieldNames = List.Distinct(List.Combine(List.Transform(SourceList, each Record.FieldNames(_)))), #"Expanded Column1" = Table.ExpandRecordColumn(#"Converted to Table", "Column1", FieldNames, FieldNames) in #"Expanded Column1" -
Replace
[YOUR_TABLE_ID]and[YOUR_API_TOKEN]with your actual data.If you are self-hosting, ensure your
BaseURLmatches your self-hosted domain**.** -
Click Done to save changes.
.jpg)
After pasting this new M Code into the Advanced Editor, you will need to manually review the data types. Since the M Code dynamically expands all fields, it cannot guess the correct type (Text, Date, Number) for every column.
How It Works:
FetchPage()function gets one page and returns results + next URLFetchAllPages()recursively calls itself untilnextis nullList.Combine()merges all pages into one list- It scans your data to find the column names automatically, so you never have to update the code when you add fields in Baserow.
- Standard transformation converts to table
If you are working with a large dataset, you can set up incremental refresh so Power BI only downloads the new rows next time.
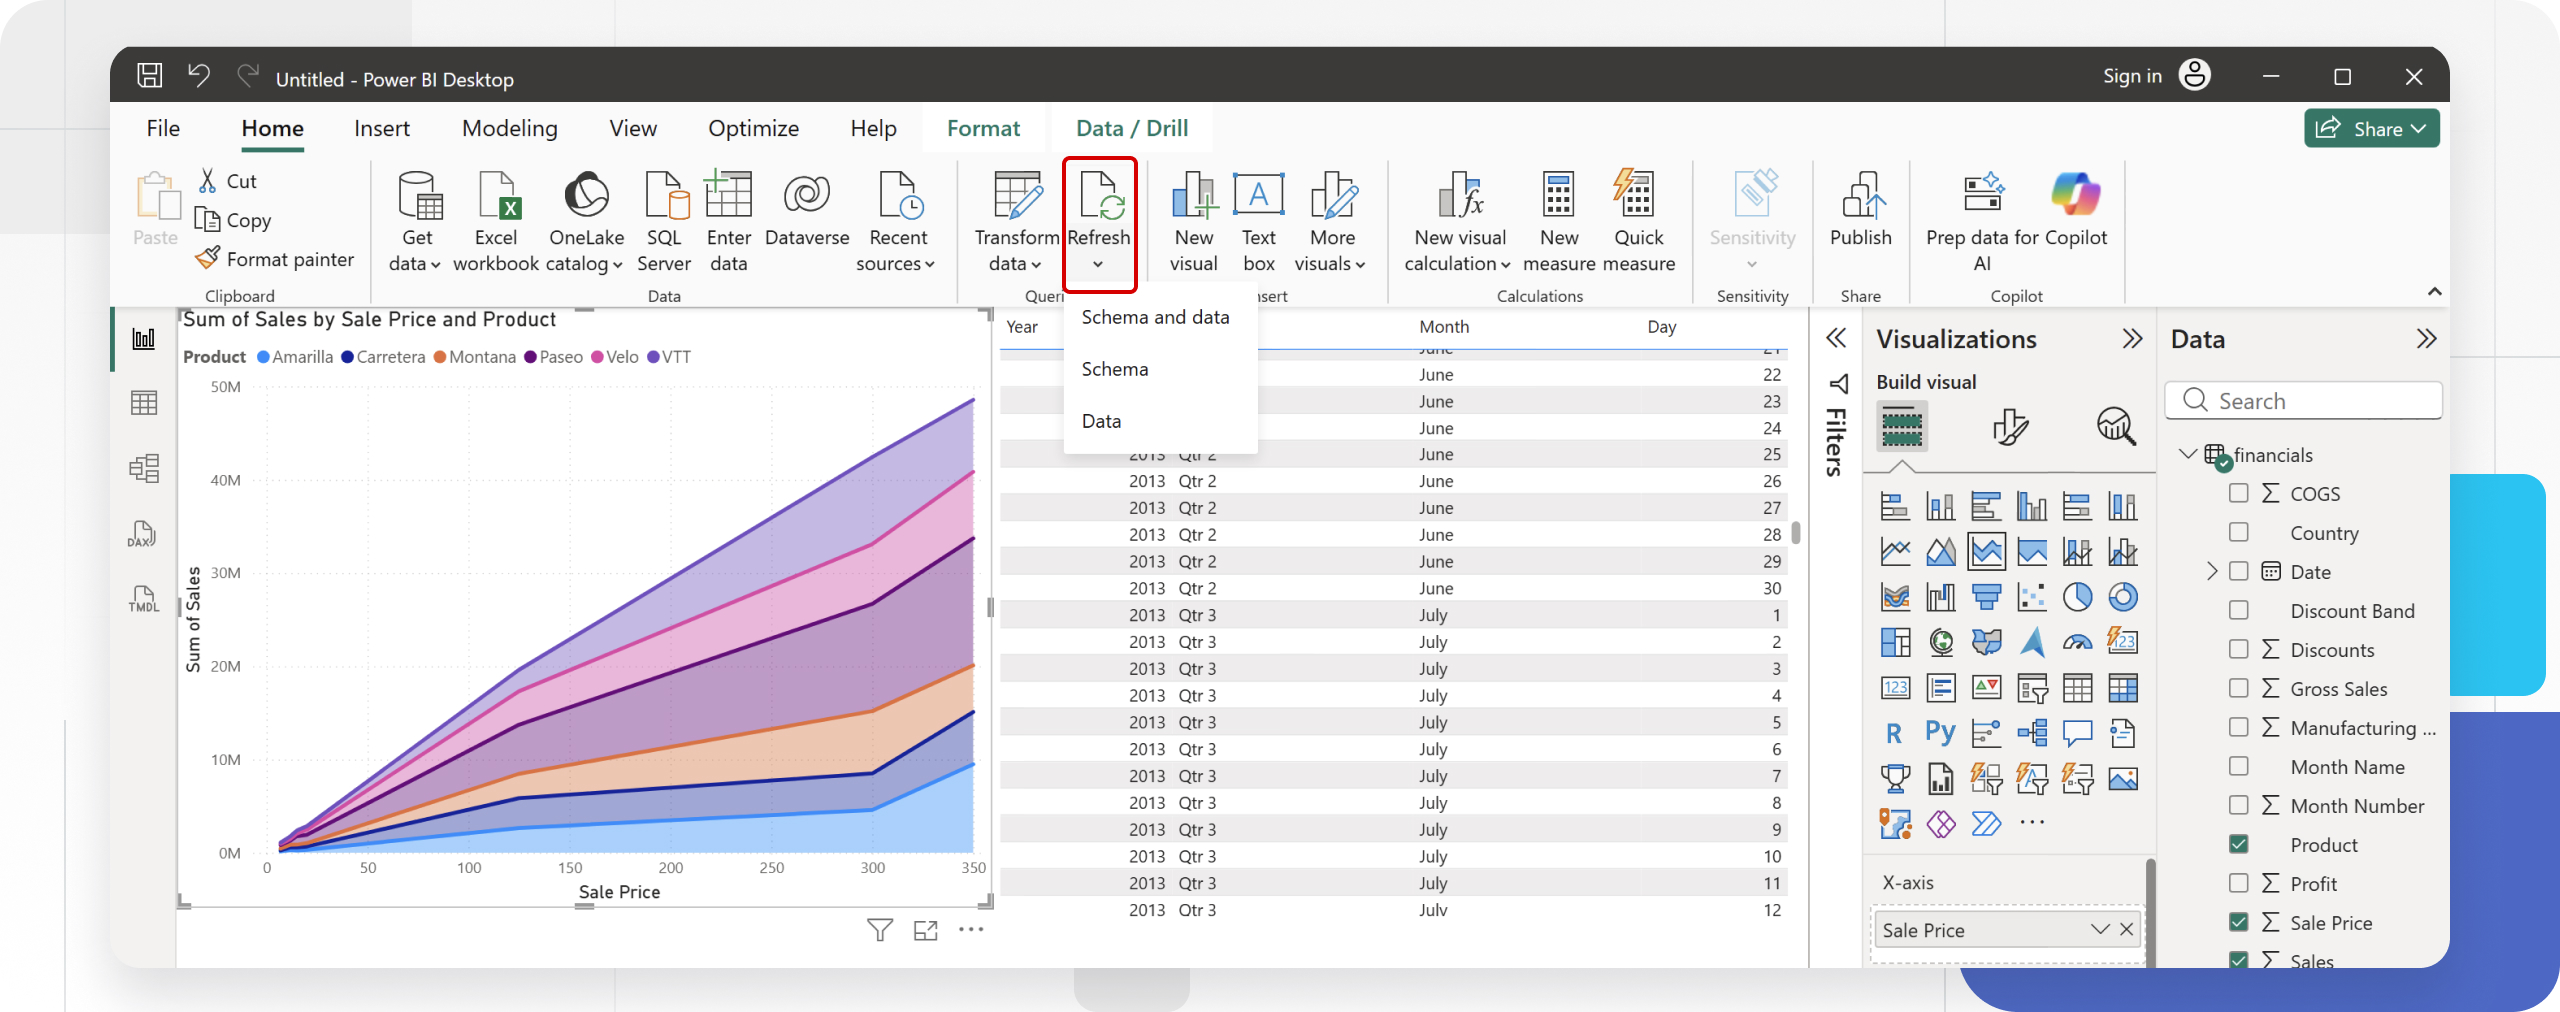
Sync data by setting up automated refreshes
One of the most common questions is: “If I change a row in Baserow right now, does it change in my Power BI chart immediately?”
The answer is: No, it is not instant. ****Power BI doesn’t auto-refresh while viewing. How to make data dynamic:
-
In Power BI Desktop: You must manually click the “Refresh” button in the Home ribbon. When you click that, Power BI calls the Baserow API again, fetches the new data, and updates your charts.
-
In Power BI Web Service: You can set up a Scheduled Refresh (e.g., every morning at 9:00 AM or every hour).
Because this connection uses an API Token for security, the Power BI Service generally cannot refresh Web APIs that use custom headers automatically unless you install the On-Premises Data Gateway.
Query Folding
Large datasets and complex transformations can slow down your reports.
Web connectors don’t support query folding, so all transformations happen in Power BI. Do as much filtering/sorting at the API level using URL parameters.
Example of API-level filtering:
// Filter at API levelSource = Json.Document(Web.Contents(
    "https://api.baserow.io/api/database/rows/table/12345/",    [Query=[
        user_field_names="true",        #"filter__Status__equal"="Active"    ]]
))
Power Query pushes transformations back to the data source (API) instead of processing locally.
Supported data types and structures
Baserow Field Types and Power BI Translation
| Baserow field type | Power BI data type | Notes |
|---|---|---|
| Text | Text | Direct mapping |
| Long Text | Text | Direct mapping |
| Number | Decimal Number / Whole Number | Choose based on decimal places |
| Rating | Whole Number | Stars become integers (1-5) |
| Boolean | True/False | Direct mapping |
| Date | Date | ISO 8601 format (YYYY-MM-DD) |
| Last Modified | DateTime | Timestamp with timezone |
| Created On | DateTime | Timestamp with timezone |
| URL | Text | Stored as text; hyperlinks in visual |
| Text | Stored as text | |
| Phone Number | Text | Stored as text to preserve formatting |
| Single Select | Text | Returns selected option |
| Multiple Select | Text (comma-separated) | Requires splitting in Power Query |
| File | Text (JSON) | Returns array of file objects with URLs |
| Link to Another Record | Text (JSON) | Returns array of linked record IDs |
| Lookup | Text | Returns looked-up value |
| Formula | Varies | Depends on formula output type |
| Rollup | Number | Aggregated value from linked records |
| Count | Whole Number | Count of linked records |
| Autonumber | Whole Number | Sequential identifier |
Handling Link to Another Record
Link to Table returns a list of IDs and values. API returns: [{id: 1, value: "Project A"}]
{ "linked_field": [ {"id": 1, "value": "Record 1"}, {"id": 2, "value": "Record 2"} ]}
Power BI can’t auto-detect relationships between linked Baserow tables. You must manually create relationships in data model.
When you have a “Link to Table” field (e.g., a Company linked to a Contact), you have two ways to handle this in Power BI.
Method 1: Best for simple reports
In Power Query, “Expand” the linked column to pull in the name of the company right next to the contact. Expand to new rows, then expand to select the value field. This creates one main table.
Method 2: Best for complex reports
If you merge “Customer Name” onto 10,000 “Orders” in Power Query, you are duplicating the text “John Smith” 10,000 times.
Instead of merging the Link to Table relationship in Power Query, you ingest two separate tables into Power BI: one for Contacts and one for Companies.
- Load both tables separately.
- Go to the Model View (the third icon on the left sidebar).
- Drag the
Company_IDfrom the Contact table to theIDin the Company table.
This is much faster for Power BI to process and allows you to slice and dice data across different tables without creating duplicates. This allows you to filter multiple tables by a single slicer easily.
This requires fetching the linked table separately and performing a merge in Power Query.
Baserow field names
In this tutorial, we add ?user_field_names=true to the API endpoint because seeing a column named "Client Status" is easier than seeing "field_482".
However, if a user renames the column in Baserow from “Client Status” to “Customer Status”, the Power BI refresh fails immediately because it can no longer find the column it’s looking for.
For production, we recommend that you import the data using the raw field IDs (e.g., field_482) where 482 is the field ID.
In Power Query, right-click the header field_482 and select Rename after importing, to change it to “Client Status” inside Power BI.
Now, you can rename the column in Baserow as much as you want, and your report will never break, because Power Query grabs it by ID and the underlying ID (field_482) never changes.
Troubleshooting
| Error Code | Meaning | Solution |
|---|---|---|
| 401 Unauthorized | Bad Token | Check that you added the word "Token " (with a space) before the key. |
| 404 Not Found | Bad URL | Check your Table ID. Ensure you didn’t paste the Browser URL instead of API URL. |
| Expression.Error | JSON Parsing | You are trying to expand a field that is null. Add a “Remove Errors” step or use try/otherwise. |
| Credentials Required | Gateway | You are trying to refresh in the Cloud without a Gateway. Install the Gateway. |
| “This dataset includes a dynamic data source” (Refresh Failed) | Power BI Service blocks scripts where the URL changes completely inside a loop. | Use the script above. It uses RelativePath, which tells Power BI that the main server (BaseUrl) is static and safe, allowing the refresh to run in the cloud. |
Still need help? If you’re looking for something else, please feel free to make recommendations or ask us questions; we’re ready to assist you.
- Ask the Baserow community
- Contact support for questions about Baserow or help with your account.